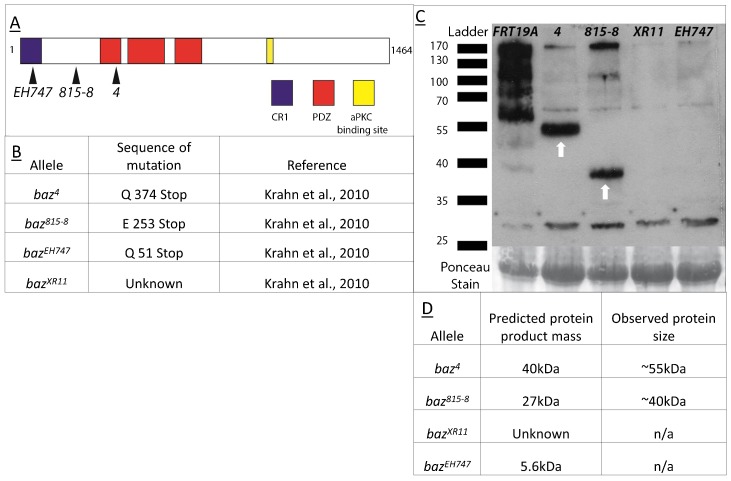
Fig. 4. Schematic representation and sequence characteristics of baz mutant alleles.
(A) Schematic representation of Baz protein with the CR1 domain shown in blue, PDZ domains in red and the aPKC binding site in yellow with black arrows indicating the approximate location of the stop codons present in the respective mutant alleles. (B) Table containing sequence details for the different baz mutant alleles. (C) Western Blot analysis of protein extracts from maternal zygotic baz4, baz815-8, bazXR11, bazEH747, and FRT19A mutant embryos. Bands at 55 and 40 kDa (white arrows) are observed in baz4 and baz815-8. Faint bands are observed in all baz allele lanes at 170 kDa. (D) Summary of results of Western blot analysis of protein extracts from maternal zygotic baz4, baz815-8, bazXR11, bazEH747 with a comparison to predicted protein product mass for each allele.

