
Figure 1.
Role of the Endogenous miR-302/367 Cluster in Regulation of hESC Growth
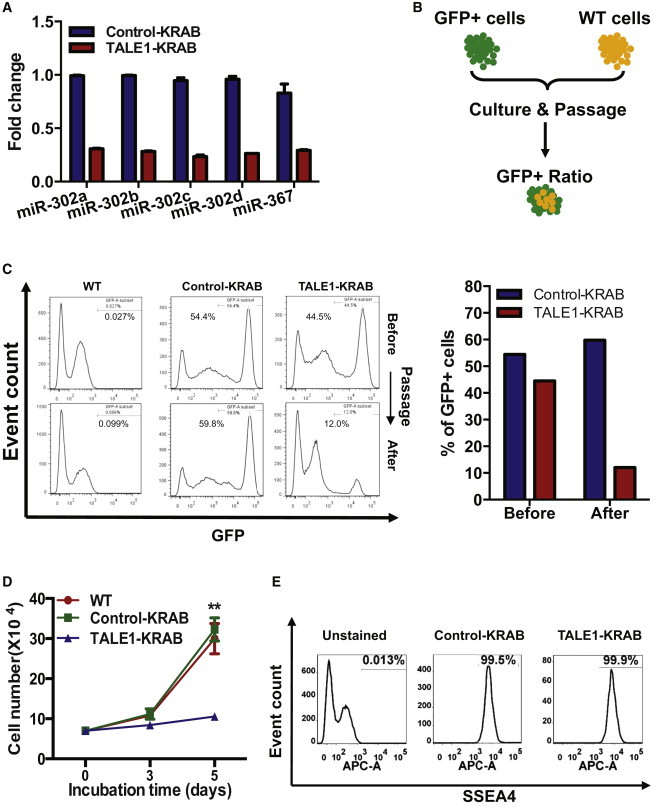
(A) qPCR analysis of mature miR-302/367 members in hESCs stably expressing control-KRAB and TALE1-KRAB. hESCs were infected with control-KRAB or TALE1-KRAB. Transcripts of miR-302/367 members were analyzed by qPCR using specific primers. Data are represented as mean ± SD of technical replicates (n = 3).
(B) Scheme of a GFP fluorescence-based growth competition assay. GFP+ hESCs (control-KRAB or TALE1-KRAB) and GFP− hESCs (WT) were mixed at nearly 1:1 ratio and cultured together for two passages. The ratio of GFP+ and GFP− cells was determined before and after passaging.
(C) Percentage of GFP+ cell populations in hESCs stably expressing control-KRAB or TALE1-KRAB. (Left) A representation of flow cytometric analysis of GFP+ cells before and after passage. (Right) Percentage of GFP+ cells in hESCs stably expressing control-KRAB or TALE1-KRAB before and after passage. Data are a representative of two independent experiments.
(D) The effects of miR-302/367 cluster on the growth of hESCs. WT hESCs or stable expressing control-KRAB or TALE1-KRAB-hESCs were seeded alone in 12-well plate (7,000 cells per well). The cells were then counted at indicated time points. Data are represented as mean ± SD of three independent experiments (∗∗p < 0.01). See also Figure S1.
(E) Pluripotency analysis of hESCs stably expressing control-KRAB or TALE1-KRAB by flow cytometry. Pluripotency of GFP+ cell population was assessed by analysis of SSEA4 expression with anti-SSEA4 antibody. Data are a representative of two independent experiments.