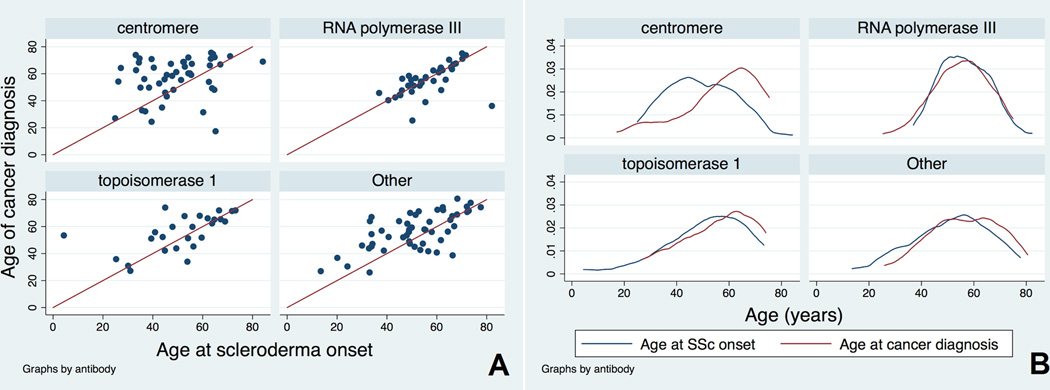
Figure 1. The relationship between age at cancer diagnosis and age at scleroderma onset.
A) The red line in each scatterplot denotes perfect concordance between age of cancer diagnosis and age of scleroderma onset, i.e. where the cancer-scleroderma interval equals zero. While a small number of patients with anti-centromere antibodies have a short cancer-scleroderma interval, the vast majority of patients have wide intervals often with scleroderma preceding cancer by many years. In contrast, patients with anti-RNA polymerase III have an almost universal short cancer-scleroderma interval, as shown by the majority of patients clustering along the red line. Among topo positive patients, the cancer-scleroderma interval shortens with increasing age at scleroderma onset. The “Other” subgroup shows features of the other 3 known antibody subsets; there is a increased clustering of cancer with scleroderma among patients with an older age at scleroderma onset, but patients with wider intervals are also present. This subgroup likely consists of patients targeting multiple autoantibody specificities, and this may account for the varied patterns observed.
B) A kernel density function illustrates the distributions of age at scleroderma onset and age at cancer diagnosis. Again the distributions of age at scleroderma onset and age at cancer diagnosis are strikingly similar for the pol positive patients, with significant overlap also noted in the topo and “Other” patient subgroups.

