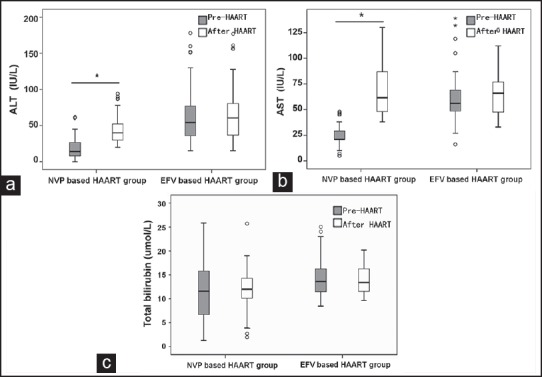
Figure 3.

The comparison of the mean levels of (a) alanine aminotransferase; (b) aspartate aminotransferase; and (c) total bilirubin in nevirapine-based highly active antiretroviral therapy (HAART) group and efavirenz-based HAART group before and after HAART. *P < 0.01, after HAART versus pre-HAART
