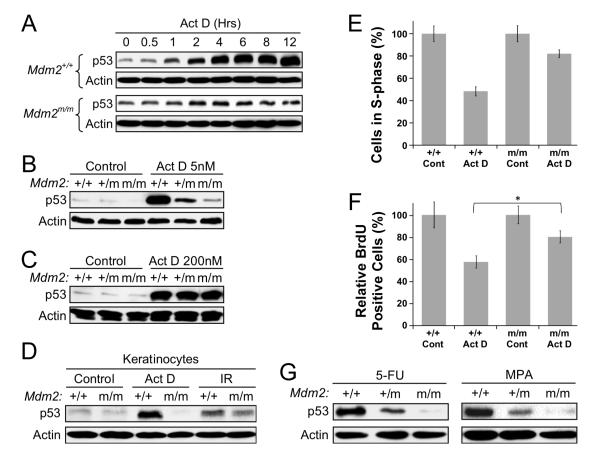
Figure 4. Mdm2C305F mice demonstrate attenuated p53 response to ribosome biogenesis stress.
(A) MEFs were treated with 5 nM Act D and harvested at indicated time points. Cell lysates were immunoblotted for p53 and Actin.
(B) Mdm2+/+, Mdm2+/m and Mdm2m/m MEFs were either mock treated or treated with 5 nM Act D for 12 hours before harvesting for western blot analysis.
(C) p53 response to a DNA damaging dosage of Act D in Mdm2m/m MEFs. MEFs were treated with 200 nM Act D for 12 hours and analyzed for p53.
(D) Mouse dorsal skins were treated topically with 200 μl of acetone (Control) or Act D (1 μg/200 μl acetone). Protein lysates were prepared from snap frozen skin collected 18 hours after the treatment by epidermal scrapes and analyzed for p53. As a positive control, dorsal skins were treated with acetone and followed immediately by whole body 8-Gy γ-irradiation (IR), and the skin cells were collected 18 hours after the treatment.
(E) Early passage MEFs were either mock treated or treated with 5 nM Act D for 18 hours. Cell cycle distribution was determined by flow cytometry using propidium iodide (PI) staining. Samples were run in triplicate with a minimum of 15,000 cells analyzed for each treatment.
(F) BrdU incorporation analysis in Mdm2m/m keratinocytes. Mouse dorsal skins were treated as in (D) and fixed in formalin 18 hours post treatment. BrdU incorporation was determined by immunohistochemistry. For quantification, BrdU positive interfollicular basal keratinocytes from 15 representative 200 μm fields were counted. Three mice were used for each group. Asterisk indicates P value of < 0.01 determined by Tukey’s multiple comparison tests.
(G) p53 response to 5-FU and MPA. MEFs were treated with 1 μM 5-FU or 2 μM MPA for 12 hours and assessed for p53 by western blotting.
Error bars in all cases represent ± SD.

