
Figure 4. VLSM of Speech Recognition and Production.
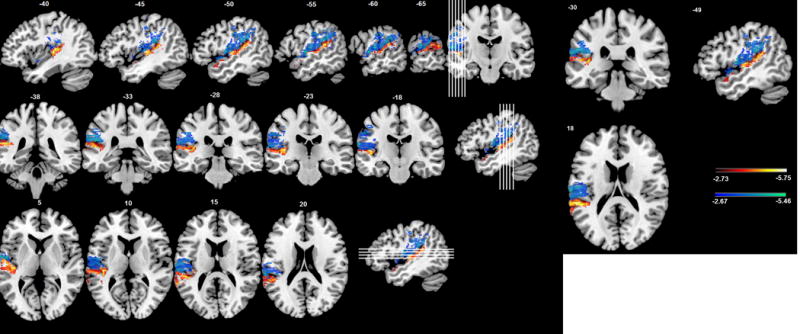
VLSM t-map showing supra-threshold (FDR q = 0.05) voxels for the Speech Production factor (blue-green) and the Speech Recognition factor (red-yellow) with direct total lesion volume control.
Official websites use .gov
A
.gov website belongs to an official
government organization in the United States.
Secure .gov websites use HTTPS
A lock (
) or https:// means you've safely
connected to the .gov website. Share sensitive
information only on official, secure websites.
VLSM t-map showing supra-threshold (FDR q = 0.05) voxels for the Speech Production factor (blue-green) and the Speech Recognition factor (red-yellow) with direct total lesion volume control.