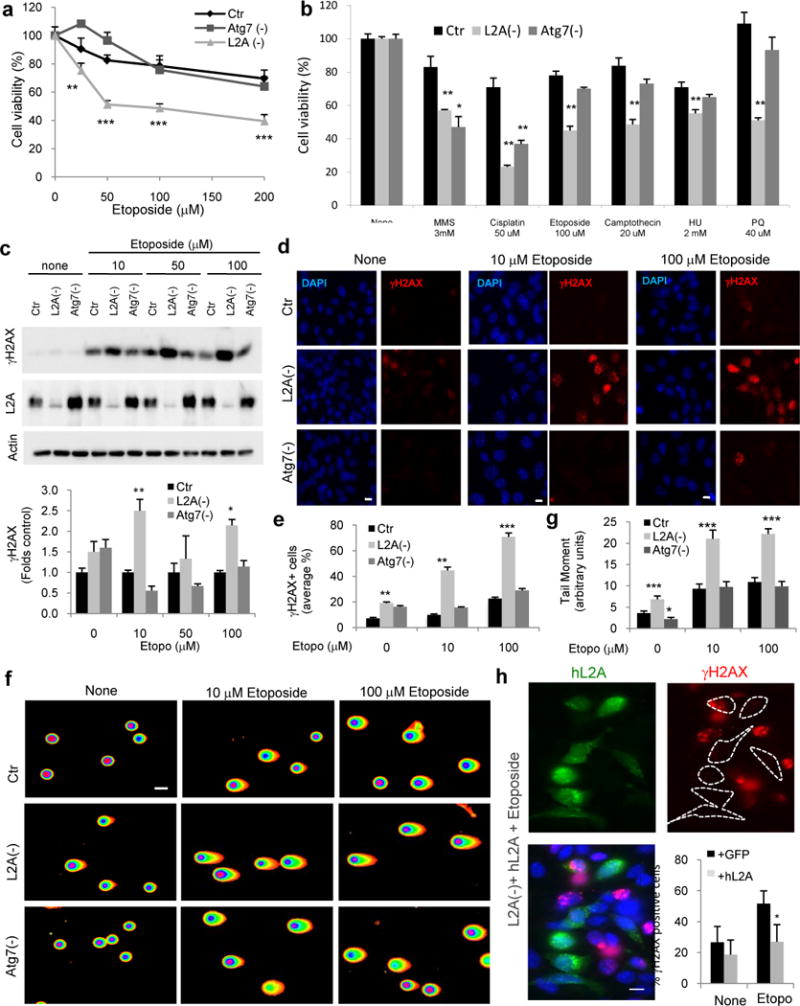
Figure 1. Blockage of CMA increases cellular susceptibility to genotoxicity.

a,b. Viability of mouse fibroblasts (NIH3T3) Ctr, L2A(−) or knock-down for Atg7 (Atg7 (−)) after 24h of etoposide treatment (a) or the indicated genotoxic insults (b), n=6 wells in 3 independent experiments. c. Representative immunoblot in the same cells as in a (top) and quantification of phosphorylated γH2AX relative to untreated cells (bottom), n=5 independent experiments. d. Immunofluorescence for γH2AX and nuclear staining by DAPI in the same cells. Scale bar: 5μm. e. Percentage of cells shown in d, with nuclear γH2AX foci (n = 3 independent experiments where the number of total cells counted per experimental condition were more than 100 (>5 fields, average 20 cells/field)). f. Neutral comet assay in the same cells, after 24h etoposide treatment. Scale bar: 10μm.g. Quantification of tail moment in the same cells (n = 3 experiments where more than 35 cells (>7 fields, ~.5cells/field) were counted per experiment. h. Immunofluorescence for γH2AX in L2A(−) cells transfected with GFP-hL2A and treated as in f. Nuclei are highlighted with DAPI. Individual and merged channels are shown. Dashed lines: Cell profiles. Scale bar: 10μm. Quantification of percent of cells with nuclear foci after GFP or GFP-hL2A transfection is shown, n=3 independent experiments. All values are mean+s.e.m. (unpaired two-tailed t-test) *P<0.05, **P<0.005 or ***P<0.0005. Full gels are shown in Supplementary Fig. 8.
