
Figure 7. Chk1 is a bona fide CMA substrate.
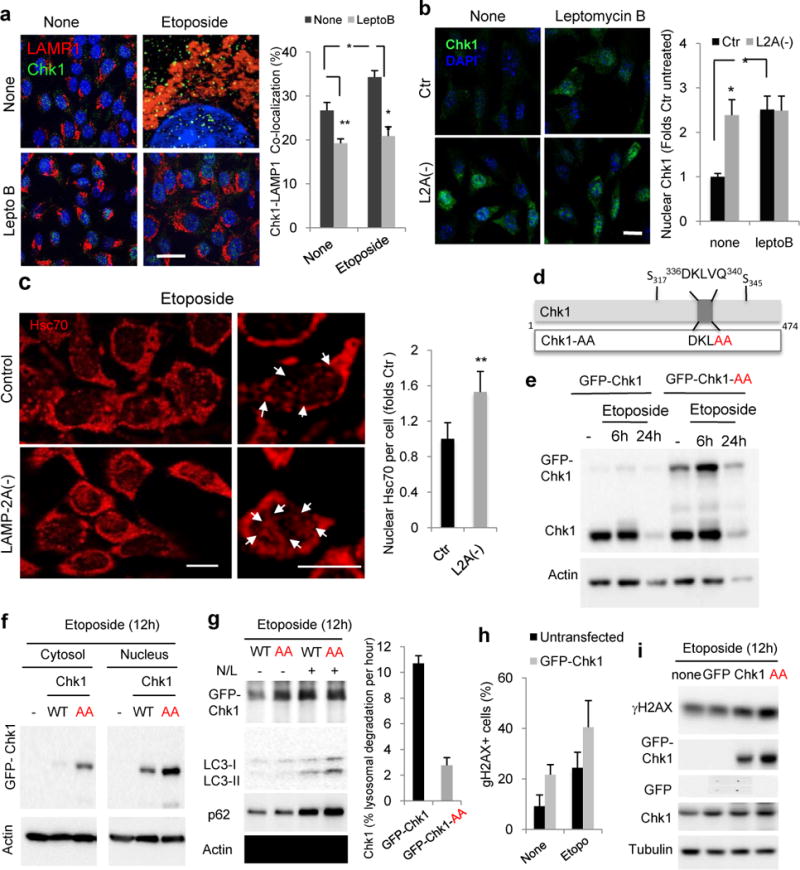
a. Immunofluorescence for Chk1 and LAMP1 in Ctr cells untreated (none) or treated with etoposide for 6h in presence or not of 20nM leptomycin B. Full fields shown in Fig. S8. Right: Percentage of colocalization in >50 cells/condition Scale bar: 5μm. (n=3 independent experiments). b. Immunofluorescence for pChk1 in control (Ctr) and LAMP-2A knock-down cells L2A(−) treated as in a. Scale bar: 10μm. Right: Percentage of nuclear pChk1 in >25 cells/condition (n=4 independent experiments). c. Immunofluorescence for hsc70 in the same cells treated with 100μM etoposide for 12h. Left: representative images. Insets: higher magnification images. Arrows: nuclear hsc70. Scale bar: 10μm. Right: Average hsc70 nuclear signal per cell in >50 cells/condition (n=3 independent experiments). d. Scheme of Chk1 CMA-targeting motif (top) and mutagenesis performed to disrupt it (bottom). e–g. Immunoblot of cell extracts (e, g) or cytosol and nuclear fractions (f) from cells expressing wild-type (GFP-Chk1) or mutant (GFP-Chk1-AA) Chk1 after the indicated treatments. N/L: ammonium chloride and leupeptin. Right in g: Percentage of Chk1 degradation per hour. n=2 independent experiments. Values are average and range. h,i. Percentage of cells with nuclear γH2AX foci (h) or levels of γH2AX (i) in mouse fibroblasts untransfected or transfected as indicated and treated with 100 μM Etoposide, n >100 cells in >5 fields from n = 3 independent experiments. All values are mean+s.e.m. (ANOVA plus Bonferroni for a and b and unpaired two-tailed t-test for the rest) *P<0.05, **P <0.005 or ***P <0.0005. Full gels are shown in Supplementary Fig. 8.