
Figure 8. Blockage of CMA leads to instability of the MRN DNA repair complex.
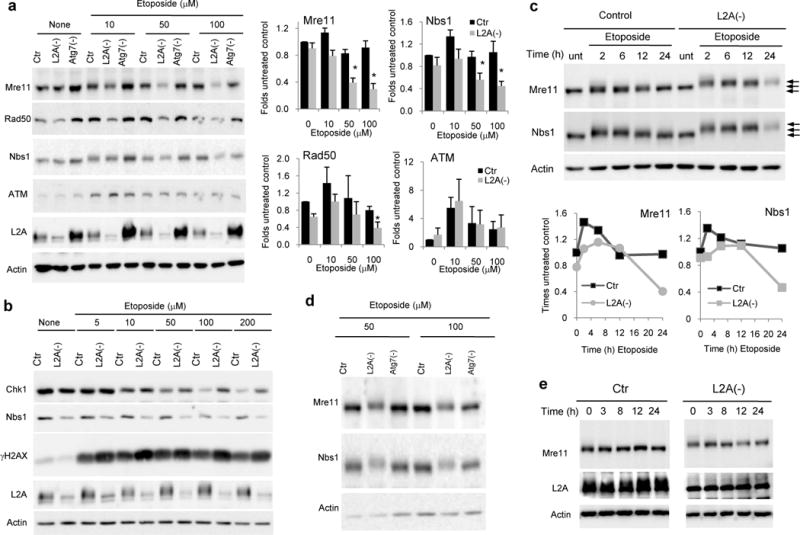
a,b. Representative immunoblots of cells control (Ctr) or knock-down for L2A (L2A−) or Atg7 (Atg7−) untreated (none) or treated with the indicated concentrations of etoposide for 12h. LAMP-2A (L-2A) is shown as control for knock-down. Right: Changes in levels of the indicated proteins calculated by immunoblot densitometry, n=4 independent experiments. c. Representative immunoblot of Ctr and L2A− cells untreated (unt) or treated with 100μM for the indicated times. Arrows: levels of shift in the protein molecular weight. Bottom: Changes in levels of the indicated proteins calculated by immunoblot densitometry, n= 2 independent experiments. d. Immunoblot for MRN complex proteins after extended electrophoretic run in Ctr, L2A(−) or cells knockdown for Atg7(Atg7(−)) treated as in b with etoposide for 12h. e. Immunoblot for Mre11 in the same cells at the indicated times after exposure to γ-irradiation. All values are mean+s.e.m except panel c that are average and range. (unpaired two-tailed t-test). *P <0.005. Full gels are shown in Supplementary Fig. 8.