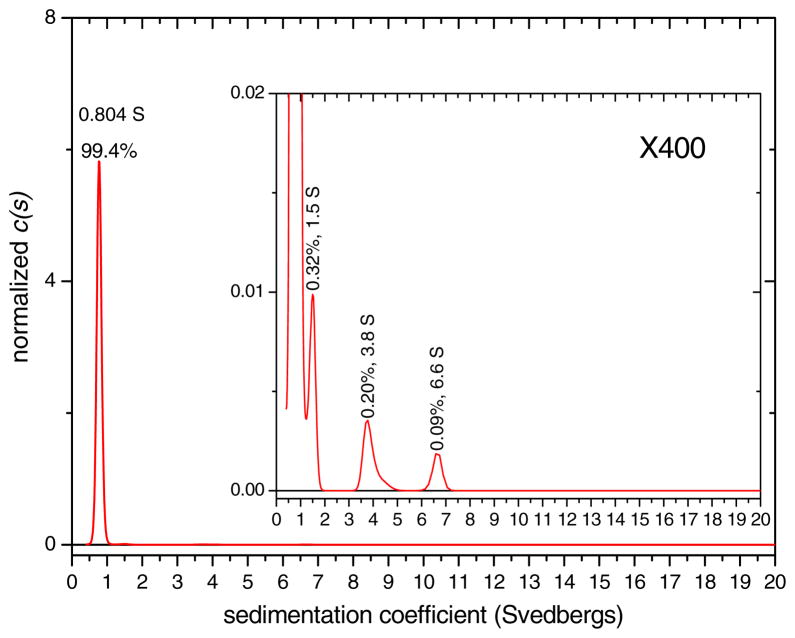
Figure 3.
Normalized sedimentation coefficient distribution for LRAP(+P) in 150 mM NaCl, pH 7.4 SCP solution at 2 mg/mL with a 400x expansion in the inset. Peaks are labeled with % amount and sedimentation coefficient, s20,w, value in svedbergs (S). The main peak was determined to represent a monomer and the s20,w value of the monomer peak is the average over the peak.

