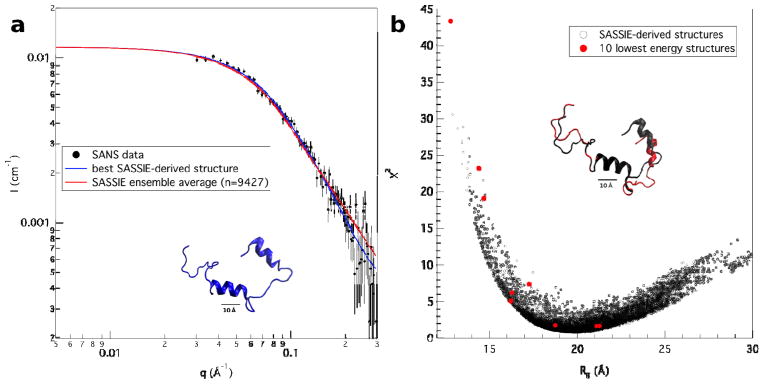
Figure 6.

a) The SANS data from 2 mg/mL LRAP(+P) in 2% acetic acid (pH 2.7) along with the corresponding average (red) and best-fit (blue) model trace from the SASSIE calculations. The best-fit (blue) LRAP(+P) structure is shown under the traces. b) A χ2 versus Rg plot for the ensemble of 9427 SASSIE structures derived from the SANS data for 2 mg/mL LRAP(+P) in 2% acetic acid (pH 2.7). The corresponding points for the 10 lowest energy Rosetta model structures are shown in red. The best-fit (black) SASSIE structure and best-fit (red) lowest energy Rosetta structure are superimposed above the traces.
