Figure 1.

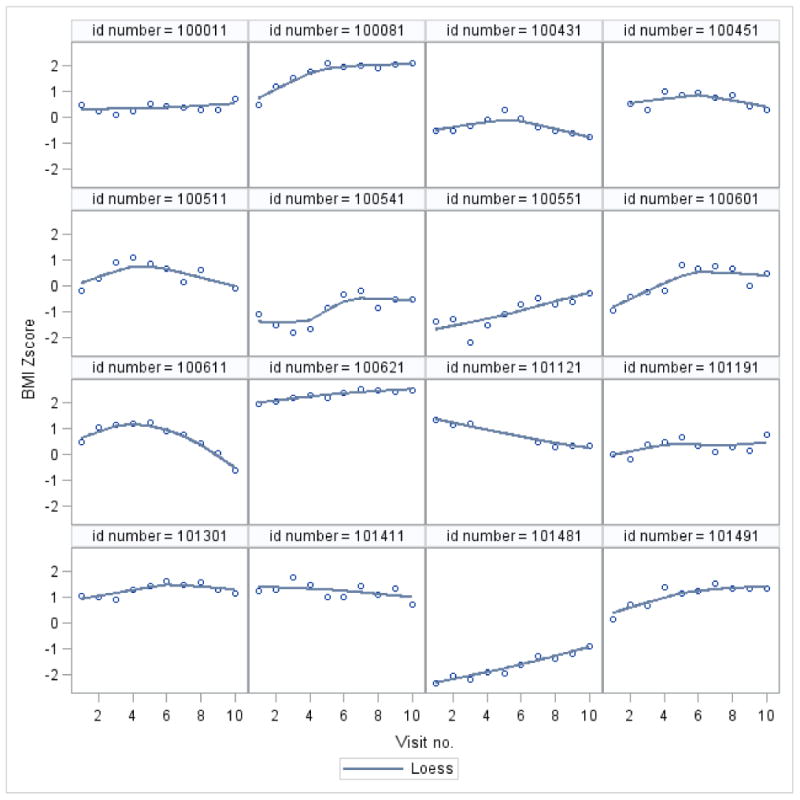
Sample of 16 BMI z-score trajectories of participants in the NGHS study. Scatterplots of BMI z-score versus visit number are overlaid with loess (locally weighted scatterplot smoothing) curves

Sample of 16 BMI z-score trajectories of participants in the NGHS study. Scatterplots of BMI z-score versus visit number are overlaid with loess (locally weighted scatterplot smoothing) curves