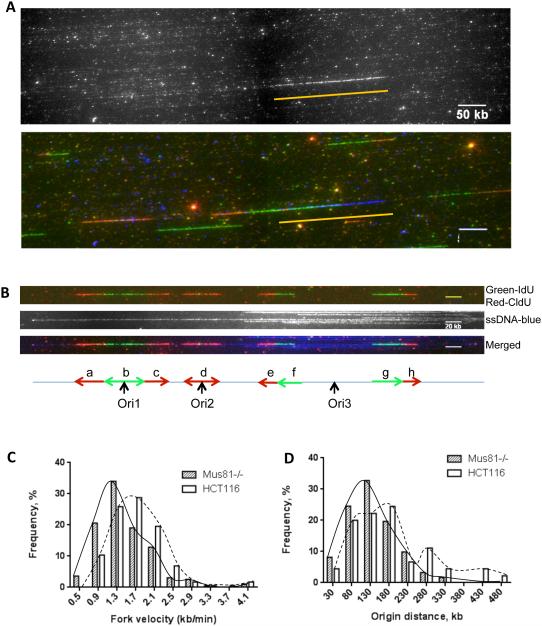
Figure 1. A high frequency of replication initiation and slower replication forks in Mus81 deficient cells.
Cells were sequentially labeled with ldU and CIdU. Extracted DNA was then stretched on silanized microscope coverslips. Regions of DNA that contained ldU and CIdU were fluorescently labeled via immunochemistry. DNA fibers were counterstained using an antibody directed against single-stranded DNA to exclude end-fiber replication tracks from progression-rate calculations, and to ensure that origins used to calculate an inter-origin distance were on the same fiber. (A) Raw images that include a FISH signal (top, traced by a yellow line) and a merged image of FISH (blue) and replication signals (green for IdU and red for CldU).A BAC of known size was used as the FISH probe for fiber size calibration. Scale bar, 50kb. (B) Typical replication signals (replicating DNA, top; anti-single strand DNA (ssDNA) antibody to trace DNA fiber, middle; Merged image, blue for ssDNA, bottom). The corresponding schematic diagram is shown underneath the fluorescence images (see Supplementary Fig. 2 for more DNA fiber examples). Replication initiation events occurred either during the initial IdU labeling (Ori1), during the secondary CldU labeling (Ori2), or before labeling was initiated (Ori3). Inter-origin distances were measured in fibers that contained at least two initiation events. Replication tracks that represented 20 min of DNA synthesis (a, c, e, f, g and h) were used to calculate replication fork velocity. Replication tracks that represented less than 20 min (b, d, initiated during a labeling), or that localized to the end of the DNA fiber (not showed) were not used. Scale bar, 20kb. (C, D). Data were binned and the percentage of replication signals that corresponded to a particular range of replication-rate (C) or inter-origin distance (D) was plotted for both Mus81-proficient (HCT116) and Mus81-deficient (Mus81−/−) cells. Mus81-deficient cells exhibited slower replication fork progression (C), and a higher frequency of replication initiation events (D). (C) and (D) are representative graphs from 3 experiments. Statistical analyses are shown in Supplementary Table 1.

