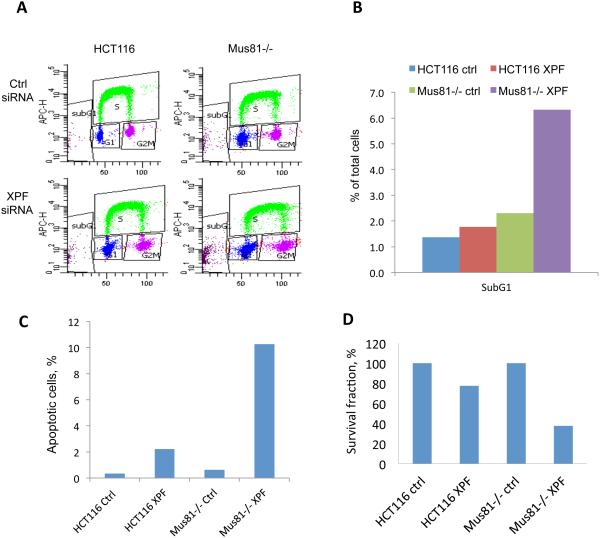
Figure 9. Effects of depletion of XPF on Mus81−/− Cell Survival.
HCT116 and Mus81−/− cells were transfected with control siRNA or XPF siRNA as described in Figure 8. (A) Cell cycle analysis by FACS. Cells were pulse-labeled with EdU for 45 min before harvesting. Cell cycle was tested with a Click-iT EdU kit by FACS. Examples of bivariate FACS were shown and percentage of cells in each cell cycle was shown in Supplementary Table 5. (B) Histogram of percentage of subG1 from Figure 9A. (C) The % of apoptotic cells was measured by TUNEL assay. Cells were transfected with control siRNA or XPF siRNA twice with 72 hours interval and collected 72 hours after the second transfection. TUNEL positive cells were analyzed by FACS (see Supplemental Figure 6B for the FACS dot plots). (D) Clonogenic assays. 24 hours after the second siRNA transfection, cells were seeded into 6-well plates at 50, 250, or 1000 cells per well. Two weeks later, cells were fixed and stained to count the colonies.

