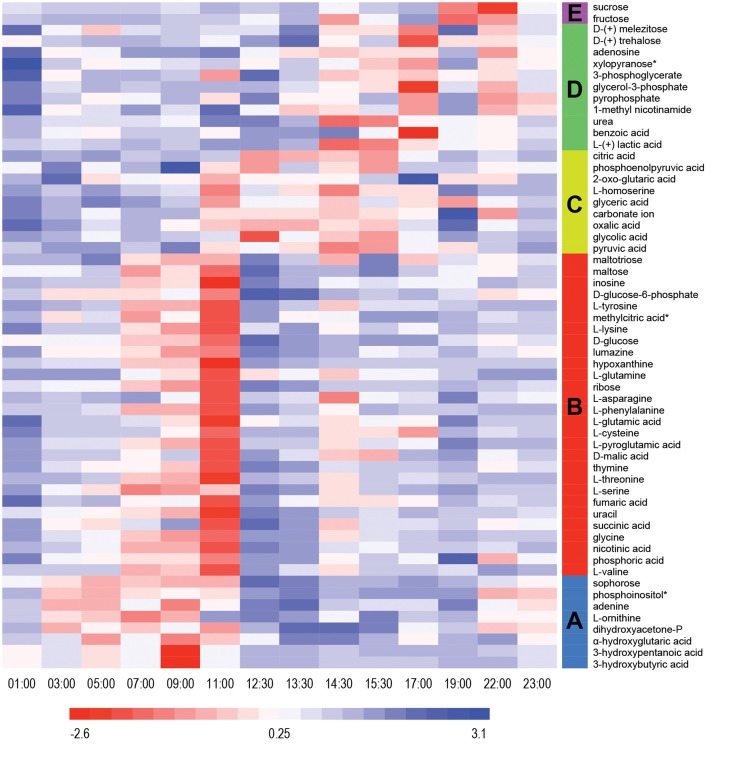
Figure 2.
Heat map view of z-scored polar metabolite abundances over a diel cycle. A total of 58 metabolites were reproducibly detected (n = 3) and confidently identified in the mat samples. The scale bar indicates the z-score transformed average intensity values of metabolites. K-means clustering was performed to categorize the metabolites based on their diel abundance patterns. Cluster A—increase in early morning; Cluster B—increase in late morning; Cluster C—increase in afternoon; Cluster D—increase in late afternoon/early evening; Cluster E—increase at night.

