Figure 5.
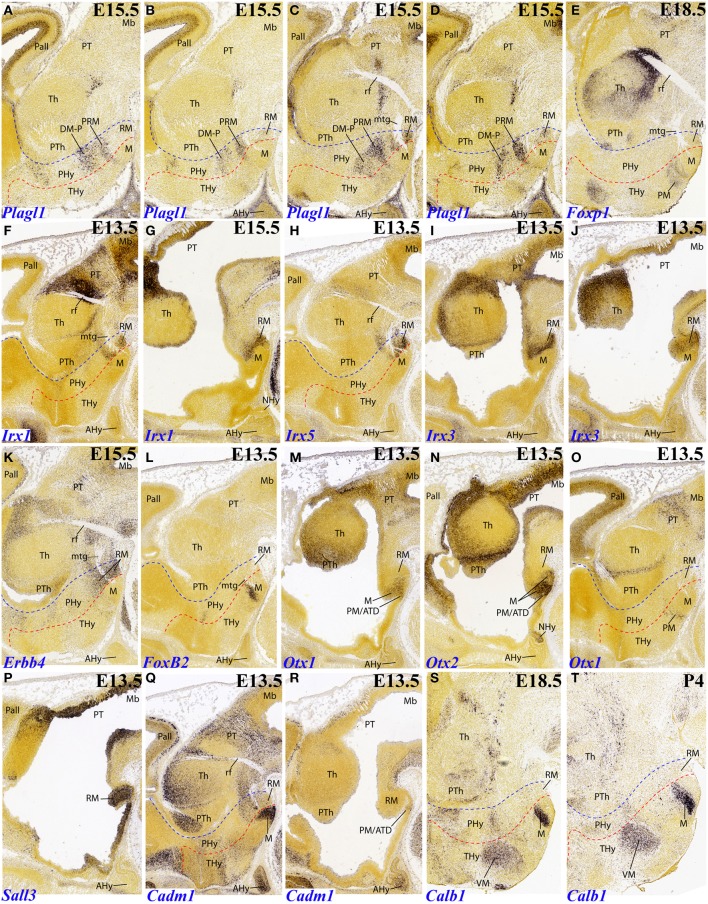
Sagittal and parasagittal (A–T) sections through the mouse secondary prosencephalon and diencephalon at E11.5, E13.5, E15.5, E18.5, and P4, showing relevant examples of hypothalamic genes expressed selectively at the terminal (THy), peduncular (PHy) or acroterminal (ATD) territories: Plagl1 (A–D), Foxp1 (E), Irx1 (F,G), Irx5 (H), Irx3 (I,J), Erbb4 (K), FoxB2 (L), Otx1 (M,O), Otx2 (N), Sall3 (P), Cadm1 (Q,R), and Calb1 (S,T). All images were downloaded from the Allen Developing Mouse Brain Atlas (http://developingmouse.brain-map.org/). For abbreviations, see the list. Red dotted line: THy/PHy boundary. Blue dotted line: PHy/p3 boundary.

