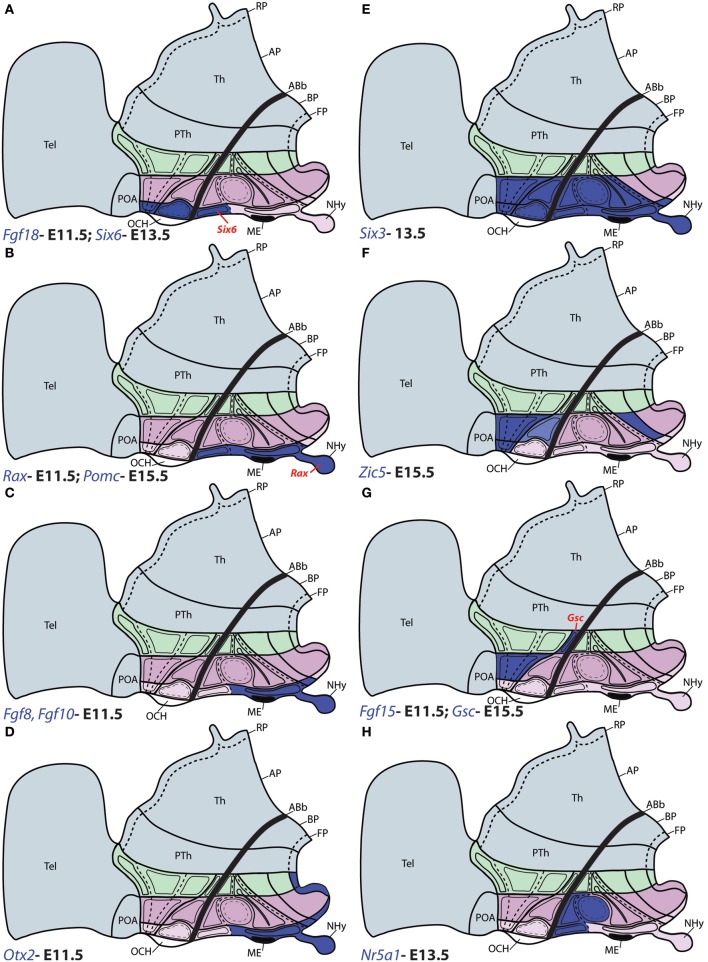
Figure 6.
Schematic maps of characteristic genoarchitectonic patterns in the hypothalamus, illustrating studied patterns selective for the acroterminal (ATHy), terminal (THy) or peduncular (PHy) hypothalamic domains. Compare subdivisions with Figure 1. (A) The Fgf18 and Six6 domains overlap within alar ATHy domains; but only Six6 (red tag) is detected at the acroterminal TuD domain. (B) Rax and Pomc were detected along the acroterminal tuberal domains; but only Rax was observed at the NHy (red tag). (C) Fgf8 and Fgf10 were detected along the intermediate and ventral basal tuberal acroterminal domains, including NHy, extending also into the acroterminal perimamillary area. (D) Otx2 was observed at the acroterminal TuI, TuV, PM, and M domains, as well as along the THy and PHy floor plate. (E) Six3 was throughout the alar domains of ATHy and THy; but at the basal plate its expression was restricted to the Tu region of ATHy and THy, and ATHy of the PM domain. (F) Zic5 expression was detected at the alar TPa (and corresponding ATHy area) and TSPa domains of THy (but respecting the local acroterminal suprachiasmatic nucleus). Additionally, Zic5 signal also appeared restricted to the PM region of THy. (G) Fgf15 and Gsc were detected jointly at the TPa area; but only Gsc was detected in the PSPa domain (red tag). (H) Nr5a1 expression was detected in the TuD domain across ATHy and THY, and the migrated derivatives of these areas entering the ventromedial nucleus also expressed this gene within TuI.

