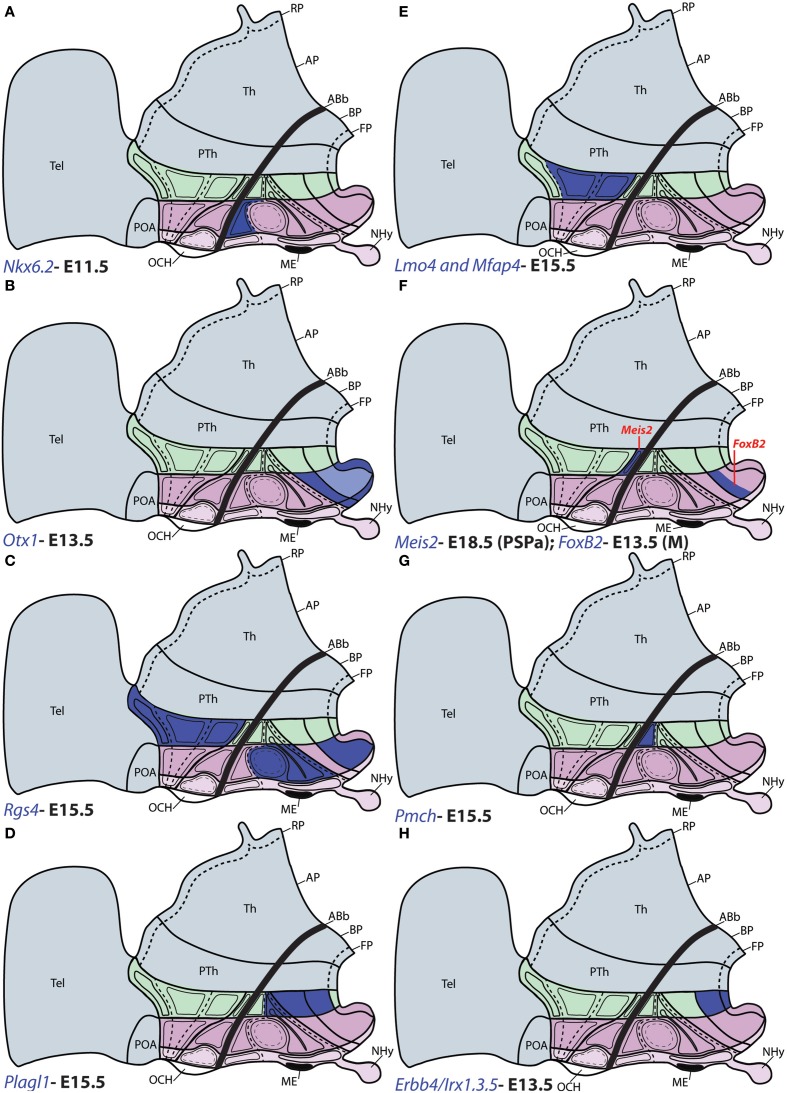
Figure 7.
Schematic maps of characteristic genoarchitectonic patterns in the hypothalamus, illustrating studied patterns selective for the terminal (THy) or peduncular (PHy) hypothalamic domains. Compare subdivisions with Figure 1. (A) Nkx6.2 was detected in the TuD domain of THy. (B) Otx1 expression was observed in the PM, M, and FP areas across ATHy and THy. (C) Rgs4 was detected at the basal TuI, TuV, and M areas from THy, as well as throughout the Pa area from PHy. (D) Plagl1 was detected at the basal RTuI, RTuV, PRM, and RM from PHy. (E) Lmo4 and Mfap4 were expressed selectively at the CPa and VPa paraventricular subdivisions within alar PHy. (F) Meis2 signal (red tag) was detected at the small PSPa domain; FoxB2 (red tag) was observed in a previously unknown dorsal subdivision of M domain (THy). (G) Pmch signal was detected only at the RTuD domain from basal PHy. (H) Erbb4, Irx1, Irx3, and Irx5 were detected at the RM and PHy FP.

