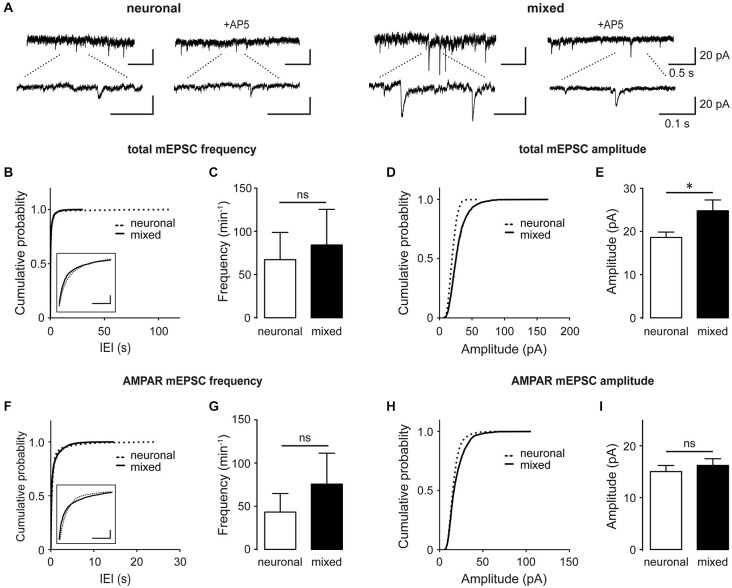
Figure 2.
Culturing neurons with glia increases the total mEPSC amplitude without significantly affecting AMPAR mEPSCs. (A) Spontaneous mEPSCs recorded at −60 mV in neuronal and mixed cultures. Total mEPSCs (left) contain both AMPAR and NMDAR-mediated components; AMPAR-mediated mEPSCs were isolated using the NMDAR blocker AP5 (100 μM, right). Bottom traces are an expanded view of top traces. (B–E) Cumulative probability and mean plots of total mEPSC frequency (B,C) and peak amplitude (D,E). (F–I) Cumulative probability and mean plots of AMPAR mEPSC frequency (F,G) and peak amplitude (H,I). For (B–I), cumulative probability plots were generated using all events from 7 cells for each culture condition; summary bar graphs show values averaged from 7 cells for each group. (*p < 0.05, t-test). In (B) and (F), the segments of cumulative probability curves with the largest difference between neuronal and mixed cultures are shown in insets (horizontal scale bars, 1 s; vertical scale bars, cumulative probability of 0.1); in both plots, the differences between the two curves were statistically significant but very small and thus likely not biologically significant.

