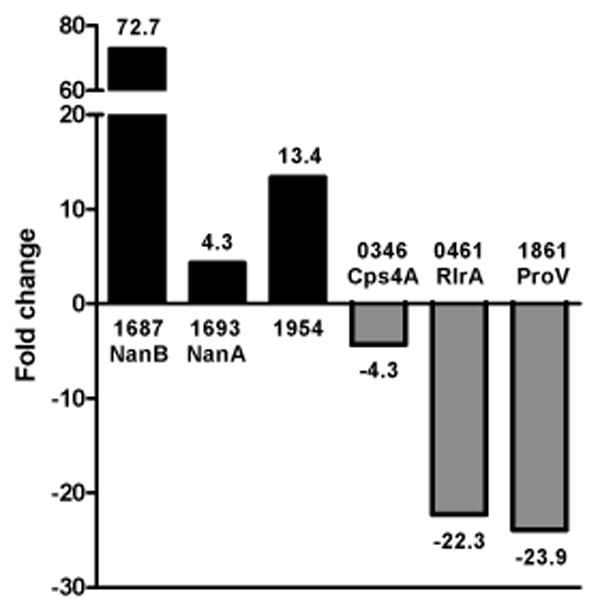
Figure 1.

Validation of microarray results by qRT-PCR. Transcription of representative genes (x axis) displaying differential expression was analyzed by qRT-PCR of pooled bacterial RNA isolated independently from samples used for array experiments. Genes are listed by their TIGR4 accession number (SP) and gene name. Scale of the fold-change (y axis) is not continuous due to highly induced expression of SP1687 (NanB) and is indicated by the broken bar.
