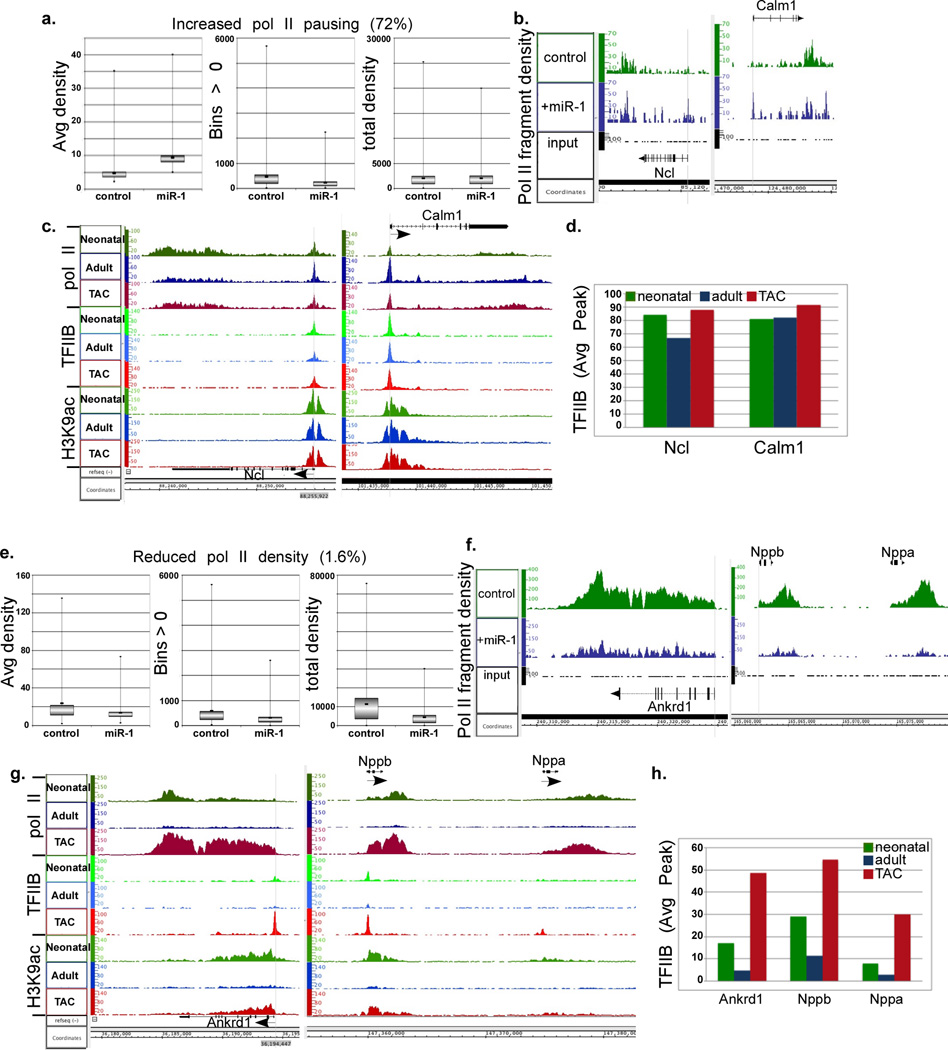
Figure 3. Constitutive vs. induced binding of TFIIB and pol II to housekeeping and specialized promoters during hypertrophy, respectively, and inhibition of the latter by miR-1.
Neonatal rat myocytes in complete growth medium were supplemented with exogenous Ad.miR-1 for 24 h or an Ad.control (scrambled), before they were subjected to pol II ChIP-Seq analysis. a. Box plots of the average densities, bin numbers, and total densities of genes with average values of miR-1/control > 1 (cutoff of pausing) combined with a total density of miR-1/control that is >0.7 and <1.6, which are the cutoff values for downregulated and upregulated genes, respectively, that are excluded from this group. b. Two gene representative of group in (a.) are shown on the right as a plot of the binary analysis results (BAR) files aligned in Affimetrix’s Integrated Genome Browser (IGB), which shows the fragments densities of pol II (y-axis) aligned in 32-nt bins along the coordinates (x-axis) for the individual genes listed. c. The IGB images for the same genes in (b.) represented in our neonatal, adult, and hypertrophy pol II and H3K9ac databases. In addition, these were aligned to our recent TFIIB ChIP-Seq data. D. The blot shows the quantitative average TFIIB peak values for the listed genes. e. Box plots of the average densities, bin numbers, and total densities of genes with average values of miR-1/control < 0.7. f. Two genes representative of group in (e.) are shown on the right as IGB images. g.–h. See the description provided for 3c.–d.

