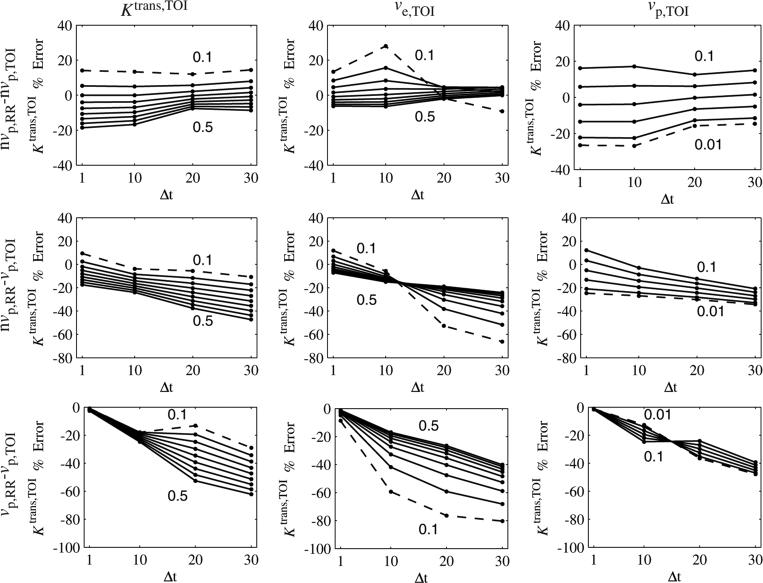
Figure 7.
Ktrans,TOI error as a function of sampling interval (Δt) and Ktrans,TOI, ve,TOI and vp,TOI. For each column, one parameter was varied, with the minimum and maximum parameter values shown in the graph (minimum shown as a dashed line). For the nvp,RR – nvp,TOI case, the dependence on the parameter values reached a minimum at Δt = 20 s. For the nvp,RR – vp,TOI case, the errors became more negative (sometimes crossing zero) as Δt increased. For the vp,RR – vp,TOI case, the errors decreased from zero as Δt increased. The sign of the dependence on vp,TOI reversed when going from Δt = 10 s to Δt = 20 s.

