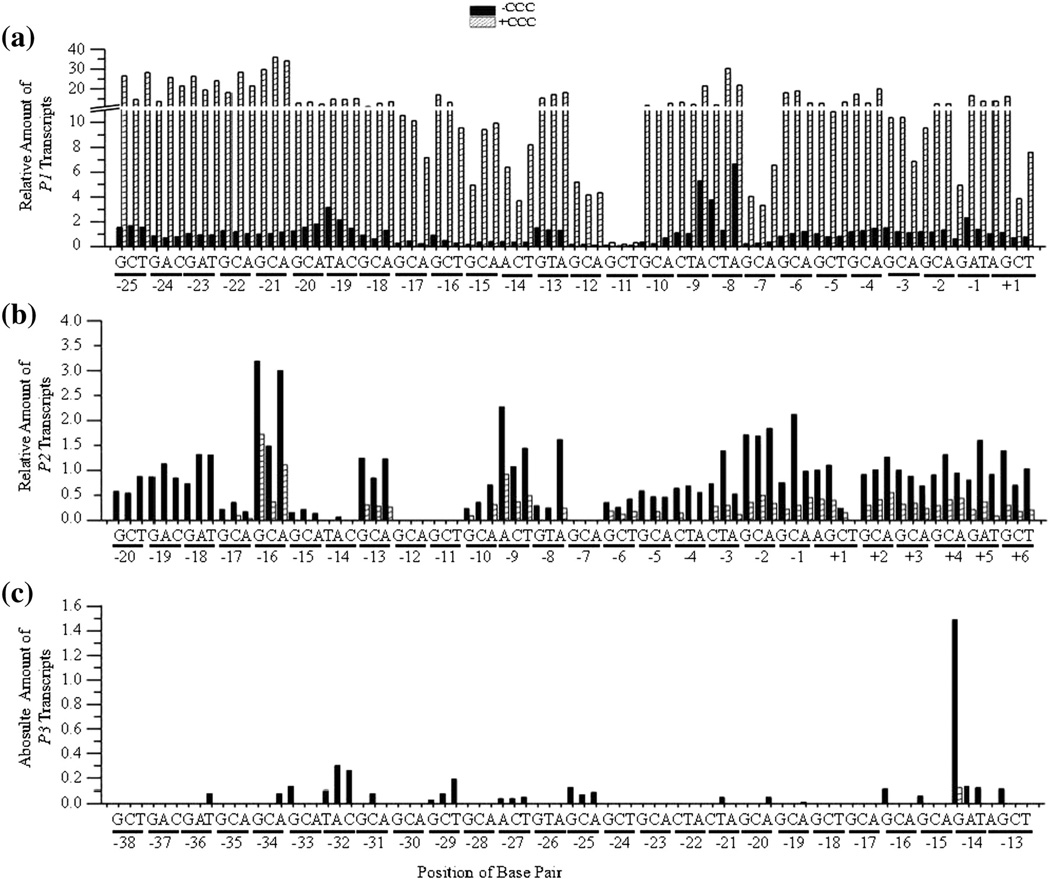
Fig. 4.
Bar graphs showing the quantification of the results shown in Fig. 2. (A) The relative amount of P1 transcripts from wild type and mutant DNA templates in the absence (shaded column) and presence (hatched column) of CCC. The y-axis contains a break from 11.0 – 11.1 with increment before and after the break of 2 and 10, respectively. The position of each base pair change from −25 to +1 is shown on the x-axis. (b) The relative amount of P2 transcripts from wild type and mutant DNA templates (positions +6 to −20). (c) The absolute amount of P3 transcripts from wild type and mutant DNA templates (positions −13 to −38).

