
Figure 4. Pairwise distances between COI DNA sequences generated by Sanger-sequencing and Illumina MiSeq sequencing for 521 individual arthropods.
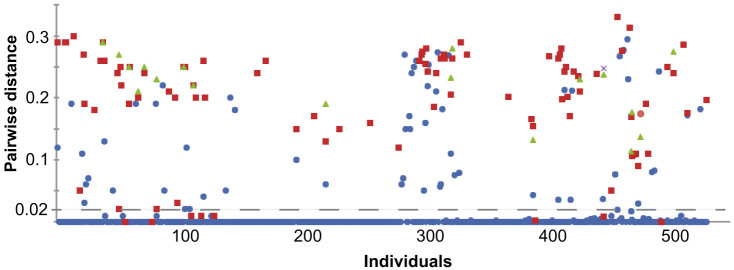
Circles represent the first Illumina generated cluster, most similar to the Sanger, with other symbols representing second, third, and fourth Illumina sequences generated from the same individual. The area below the dashed line represents all Illumina sequences sharing at least 98% sequence similarity with a corresponding Sanger sequence from the same individual.