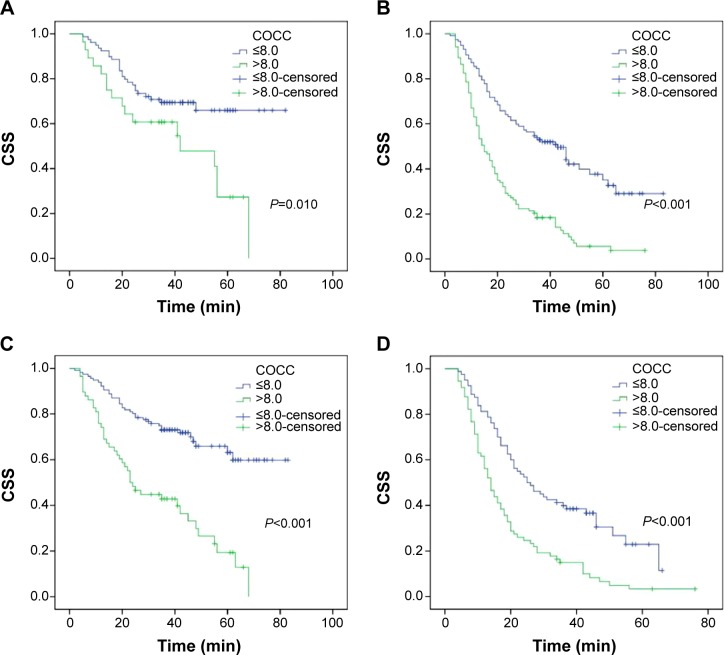
Figure 6.
Kaplan–Meier CSS curves stratified by COCC in patients with T stage and N stage.
Notes: The predictive value of COCC was significant in patients with T1–T2 (P=0.010, A), T3–T4a (P<0.001, B), N0 (P<0.001, C), and N1–N3 (P<0.001, D).
Abbreviations: CSS, cancer-specific survival; COCC, COmbination of CRP and CEA; T, tumor; N, node.

