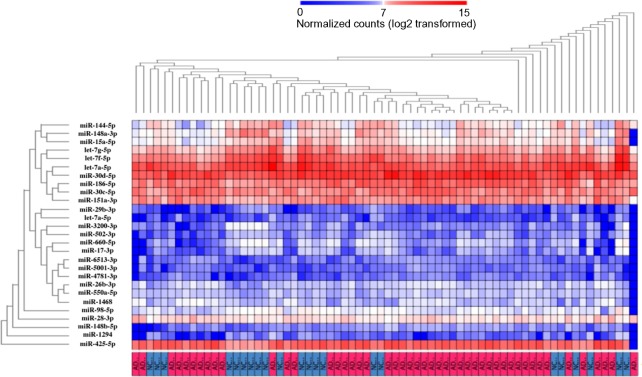
Figure 1.
HCA of 27 miRNAs differentially expressed in blood of AD and NC. miRNA-Seq dataset of blood samples derived from 48 AD patients and 22 NC subjects was analyzed on omiRas. It identified 27 differentially expressed mature miRNAs between two groups. They separated several AD subgroups (red) from NC clusters (blue), where the largest AD cluster included 23 patients (47.9%).

