2.

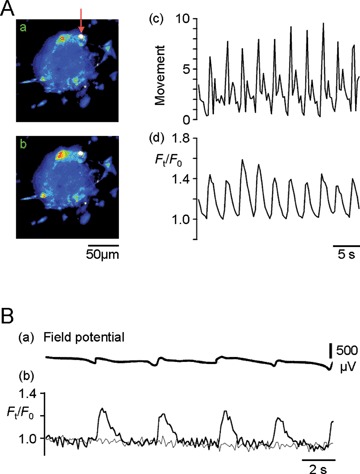
ICC [Ca2+]i oscillations synchronized with mechanical (A) and electrical (B) activities in cell cluster preparations isolated from the muscle layer of the murine small intestine. This figure was made by modifying Figure 2 of [44] and Figure 4 of [27]. (A): Ca2+ images (fluo-3 fluorescence) obtained from a cell cluster preparation with a high intensity area that could be used to monitor mechanical activity. Panels (a) and (b) are pseudo-colour Ca2+ images acquired at basal and peak times of an initial oscillation cycle in normal solution, respectively. The mechanical activity (c: movement) was estimated by tracking the high intensity area indicated by the arrow in (a). The time course of [Ca2+]i oscillations (d) was measured in the square region (red line) of the cell cluster preparation shown in (a). After this recording, using a K+ channel opener to suppress smooth muscle activity, we confirmed that ICC produced the Ca2+ activity in the square region [44]. The fluorescence is expressed relative to that at the initial basal time: Ft/F0.(B) Field potential (a) and fluo-4 fluorescence (b) were measured simultaneously in a cell cluster preparation in the presence of nifedipine which differentiates ICC activity by suppressing smooth muscle activity [27]. Thick and thin lines in (b) represent ICC and non-ICC regions of a cell cluster preparation, respectively.
