Figure 10.
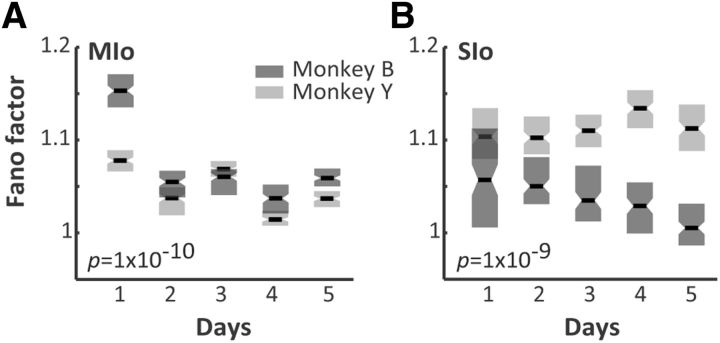
Mean-matched Fano factor for neuronal data aligned to target onset. A, Daily Fano factor of MIo neurons from each monkey separately. Shown as medians (central mark) from target onset to 1 s after target onset. Box edges correspond to the 25th and 75th percentiles. p values correspond to Kruskal–Wallis test. B, As in A for SIo neurons.

