
Figure 11.
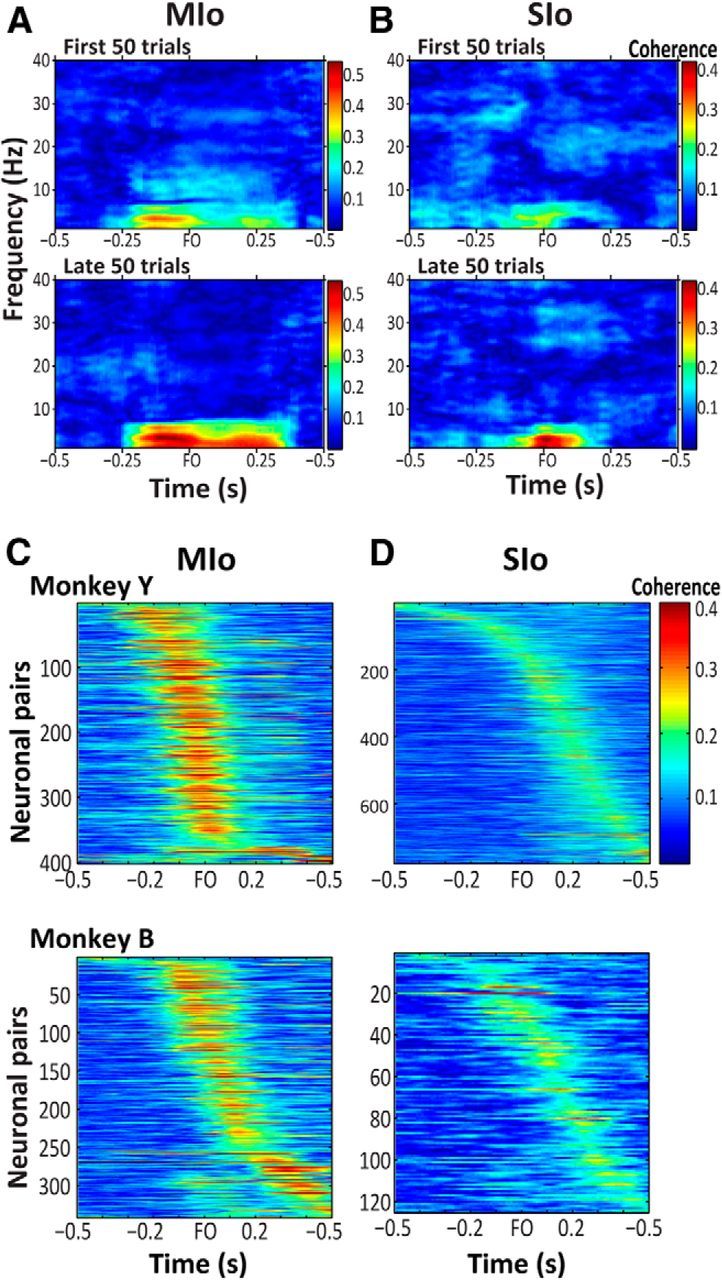
Spike–spike coherence. A, Example of coherent activity between a neuronal pair in MIo during the first and late 50 trials. Shown from 0.5 s before force onset (FO) to 0.5 s after FO. B, As in A for a neuronal pair in SIo. C, D, All neuronal pairs in MIo and SIo that modulated their coherent activity during a session. Shown for each area and monkey. Each row represents the coherent activity of a neuronal pair from 0.5 s before FO to 0.5 s after FO. Color bar represents magnitude of coherence of a neuronal pair.