Figure 12.
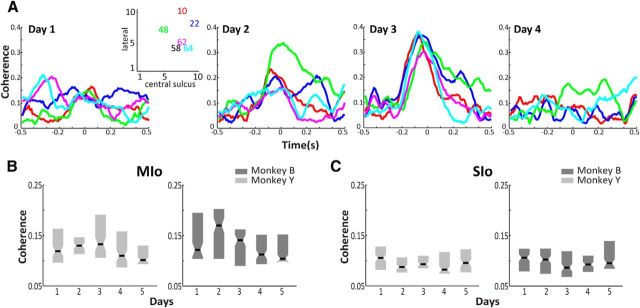
Transient changes in spike–spike coherence. A, Pairwise coherence of a subset of stable MIo neurons (5 pairs) across multiple days. Each line plot corresponds to a neuron paired with neuron 58. Inset, Position of the neurons (represented by ID numbers) on the 10 × 10 microelectrode array grid (4 × 4 mm). Data from Monkey Y. B, Mean coherent activity of the population of neuronal pairs in MIo during the late 50 trials of each analysis day, shown for Monkeys Y and B. C, As in B for the population of neuronal pairs in SIo shown for Monkeys Y and B. B, C, Kruskal–Wallis, p < 0.000001.

