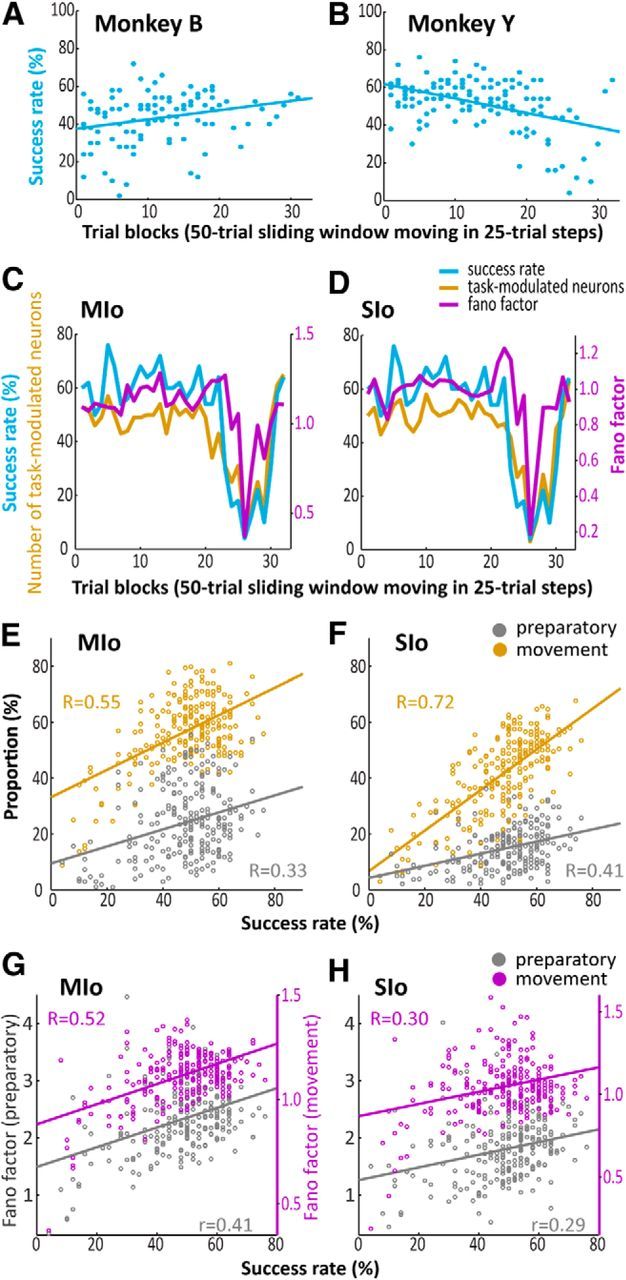
Figure 6.

Short-term changes in the proportion of task-modulated neurons and firing rate variability. A, B, Success rates as a function of trial blocks (i.e., 50 trial sliding window moving in 25 trial steps) ordered from the beginning to the end of each training session. Shown separately for Monkeys B and Y. Lines correspond to a linear fit on the data. C, D, Success rates, Fano factor, and the number of modulated MIo and SIo neurons in the movement epoch, respectively, plotted as a function of trial blocks. Shown for one dataset of Monkey Y. E, F, Correlation between success rates and the proportion of task-modulated MIo and SIo neurons, respectively, during the preparatory and movement epochs. Shown as pooled data across the monkeys for all analysis days. R, Pearson's correlation coefficient. Lines correspond to a linear fit on the data. G, H, As in E, F, respectively, showing correlation between success rates and Fano factor. There are different scales used for the Fano factor corresponding to the preparatory and movement epochs.
