
3.
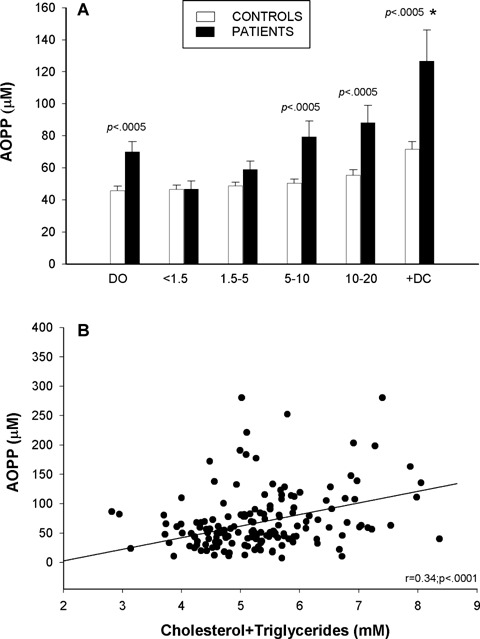
Plasma advanced oxidation protein products (AOPP) (A) in diabetic patients at disease onset [DO], during the first 20 years of disease evolution [four subgroups: <1.5, 1.5–5, 5–10, 10–20], in diabetic patients with complications [+DC] and in their respective controls; filled columns: diabetic patients data; open columns: control data. Correlation between plasma AOPP and total lipid concentrations in plasma (B). Values are expressed as mean ± SEM and were analysed for statistically-significant differences by analysis of variance (ANOVA); P values <0.05 (versusrespective control participants) were considered significant and are shown above each subgroup in the graph. * P<0.05 diabetic patients with complications [+DC] versus[10–20] subgroup of patients.