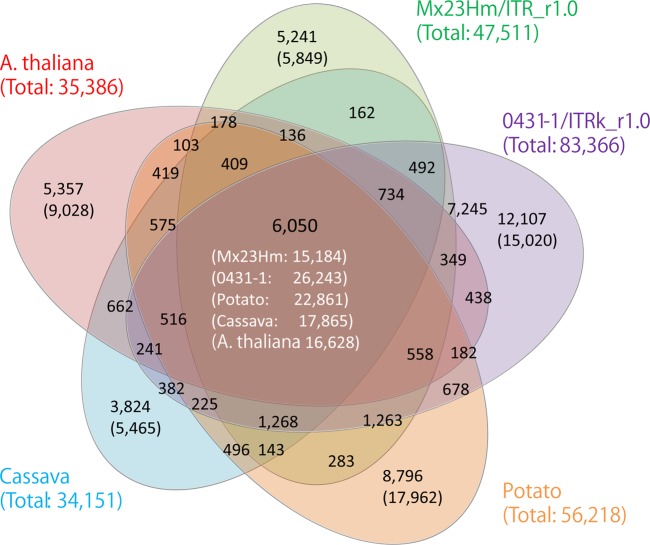
Figure 2.
Venn diagram showing the numbers of gene clusters in Ipomoea trifida and other plant species, i.e. Arabidopsis thaliana, potato (Solanum tuberosum), and cassava (Manihot esculenta). The black and white numbers in parenthesis represent the numbers of non-clustered sequences and sequences clustered with other species, respectively. The green, purple, orange, aqua, and red numbers in parenthesis represent the total numbers of putative genes subjected to clustering.

