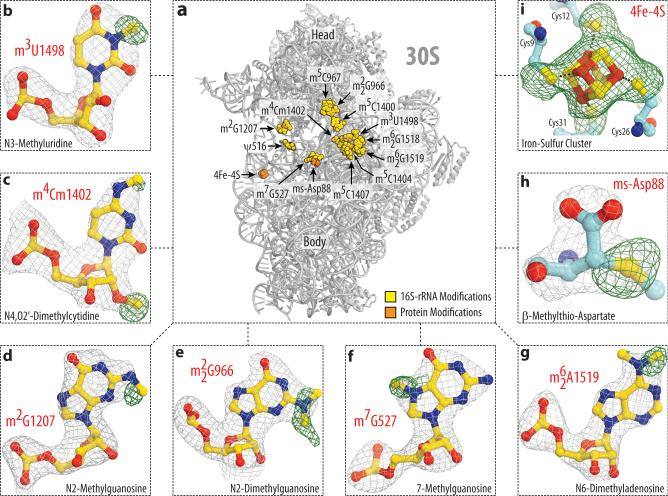
Figure 1. Electron density maps allow comprehensive modeling of rRNA and ribosomal protein modifications of the 30S subunit.
(a) Spatial distribution of modified nucleotides in the structure of the small ribosomal subunit from T. thermophilus. Here, in Fig. 2 and throughout the text rRNA nucleotides are named according to the E. coli numbering system. Panels (b-i) show unbiased difference Fo-Fc electron density maps for eight types of modifications present in 16S rRNA and ribosomal proteins S12 and S4. Grey mesh shows the Fo-Fc map after refinement with the entire modified nucleotides or amino acid residues omitted (contoured at 2.7-3.0σ). Green mesh shows the Fo-Fc electron density map after refinement with unmodified nucleotides (contoured at 1.5-2.5σ). The modifications shown are: (b) N3-methyluridine 1498, (c) N4,O2’-dimethylcytidine 1402, (d) N2-methylguanosine 1207, (e) N2-dimethylguanosine 966, (f) N7-methylguanosine 527, (g) N6-dimethyladenosine 1519; (h) β-methylthioaspartate of protein S12, (i) 4Fe-4S iron-sulfur cluster of protein S4.

