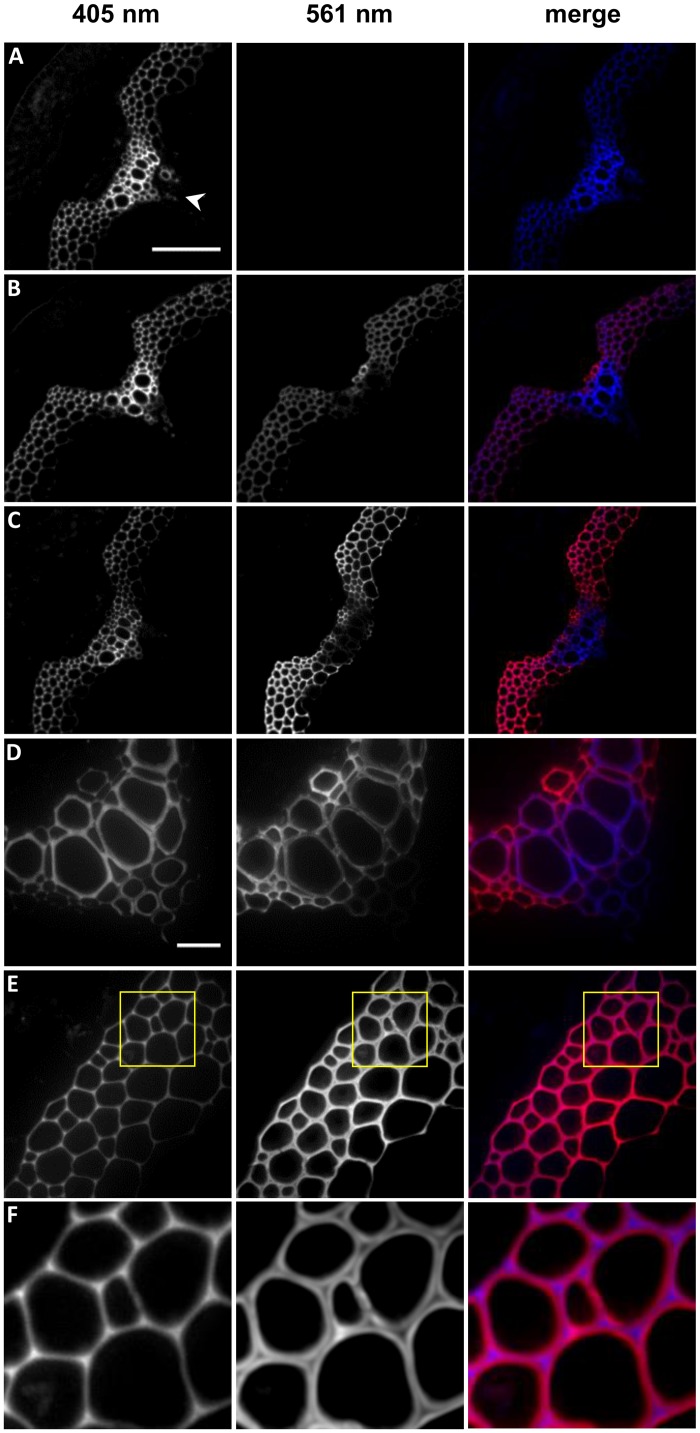
Fig 7. 3-EPC incorporation in 40 μm-thick sections of 6 week old Arabidopsis stems.
Autofluorescence (405 nm excitation) and click labeling (561 nm excitation) in (A) control section treated with 20 μM CA for 3 h, labeled with Alexa-594 azide for 1 h, and washed with 96% ethanol for 1 h; (B) section treated with 20 μM 3-EPC and 20 μM CA for 3 h, labeled with Alexa-594 azide for 1 h, and washed with 96% ethanol for 1 h; and (C) section treated with 20 μM 3-EPC for 3 h, labeled with Alexa-594 azide for 1 h, and washed with 96% ethanol for 1 h. (D) Xylem and (E) interfascicular fibers (IFFs) of section treated with 20 μM 3-EPC. (F) Zoomed-in region from image in (E), indicted by yellow box, showing incorporation patterns of 3-EPC in IFFs. Arrowhead in (A) indicates vascular bundle, with interfascicular fibers lying on either side. Images are contrast-enhanced maximum intensity projections of z series recorded with a spinning disk fluorescence confocal microscope. (A-C) were recorded using a 20X objective with a 561 nm laser at 15% power, 100 gain and 400 msec exposure time and a 405 nm laser at 100% power, 100 gain and 400 msec exposure time (scale bar, 100 μm). (D-E) were recorded using a 63X objective with a 561 nm laser at 15% power, 10 gain and 400 msec exposure time and a 405 nm laser at 100% power, 10 gain and 400 msec exposure time (scale bar, 20 μm).

