
Fig. 3. HuNoVs productively infect B cells in culture.
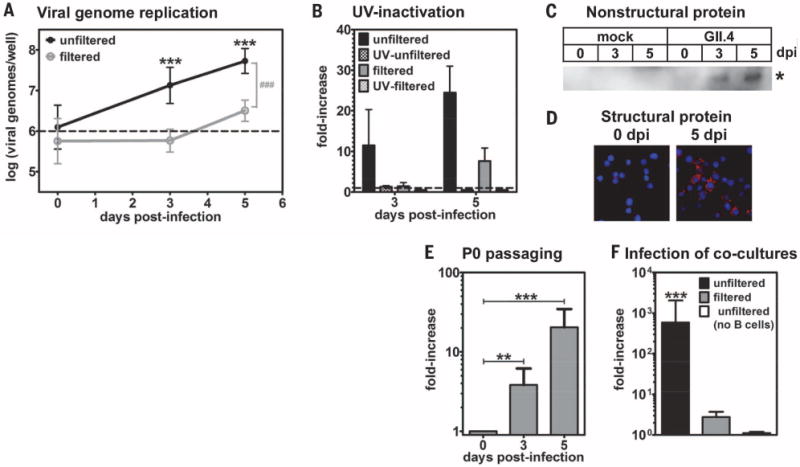
(A) A GII.4-Sydney HuNoV-positive stool sample was inoculated onto human BJAB B cells (black line) or filtered through a 0.2- μm filter before application (gray line). The inoculum contained 1 × 10⁶ genome copy numbers, indicated by a dashed line. Viral genome copy numbers per well were determined by means of genogroup II-specific quantitative RT-PCR (n = 12 experiments). The 3- and 5-dpi genome copy numbers were compared with 0 dpi under each condition for statistical purposes, indicated by asterisks. The unfiltered and filtered data sets were statistically different from each other at 3 and 5 dpi, as indicated by the gray pound sign, but not at 0 dpi. (B) 1 × 10⁶ genome copy numbers of unfiltered (black bars) or filtered (gray bars) stool inoculum was untreated (solid bars) or UV-treated (hatched bars) before inoculation onto B cells. Samples were analyzed as described above, and data were reported as the fold-increase in viral genome copy numbers from 0 to 3 or 5 dpi (n = 3 experiments). (C and D) Mock inoculum or 5 × 10⁵ genome copy numbers of unfiltered GII.4-Sydney HuNoV-positive stool was applied to BJAB cells, and the cells were washed after 2 hours. (C) Cell lysates were tested in Western blotting by using a polyclonal antibody to NS6. The asterisk indicates a band of the expected size for the HuNoV NS5-NS6 processing intermediate (35 kD) that was only observed in infected cells at 3 to 5 dpi. No mature NS6 protein was detected, which is consistent with a report demonstrating that the NS5-NS6 cleavage site of a HuNoV is processed very inefficiently by the viral protease (33). (D) Cells were stained with antibody to VP1 (red) and DAPI (blue) and imaged on a fluorescent microscope. No VP1 signal was detected in mock-inoculated cells at 5 dpi, nor infected cells stained with an isotype control antibody. (E) 5 × 10⁵ genome copy numbers of a P0 inoculum was passaged onto naïve BJABs. At 0, 3, and 5 dpi, wells were collected and analyzed by means of genogroup II-specific quantitative RT-PCR (n = 4 experiments). The data are presented as the fold-increase in genomes from 0 to 3 or 5 dpi. The genome copy numbers detected at each time point were compared with 0 dpi for statistical purposes, indicated by black asterisks. (F) 1 × 10⁶ genome equivalents of the unfiltered (black bars) or filtered (gray bars) GII.4-Sydney HuNoV-positive stool sample were applied to the apical side of a transwell with polarized HT-29 IECs grown on the membrane and BJAB B cells cultured in the basal compartment. At 0 and 3 dpi, the basal compartment was collected for viral genome analysis by means of quantitative RT-PCR (n = 5 experiments). The data are presented as the fold-increase in genomes from 0 to 3 dpi. In two experiments, unfiltered stool was applied to a coculture with no cells in the basal chamber as a control (white bars). The 3-dpi genome copy numbers were compared with 0 dpi under each condition for statistical purposes, indicated by black asterisks. Similar coculture results were obtained by using another GII.4-Sydney HuNoV-positive stool sample. For all, error bars denote mean ± SD; Student’s t test, *P < 0.05, **P < 0.01, ***P < 0.001.