
Figure 1. Interactions between visually-evoked waves.
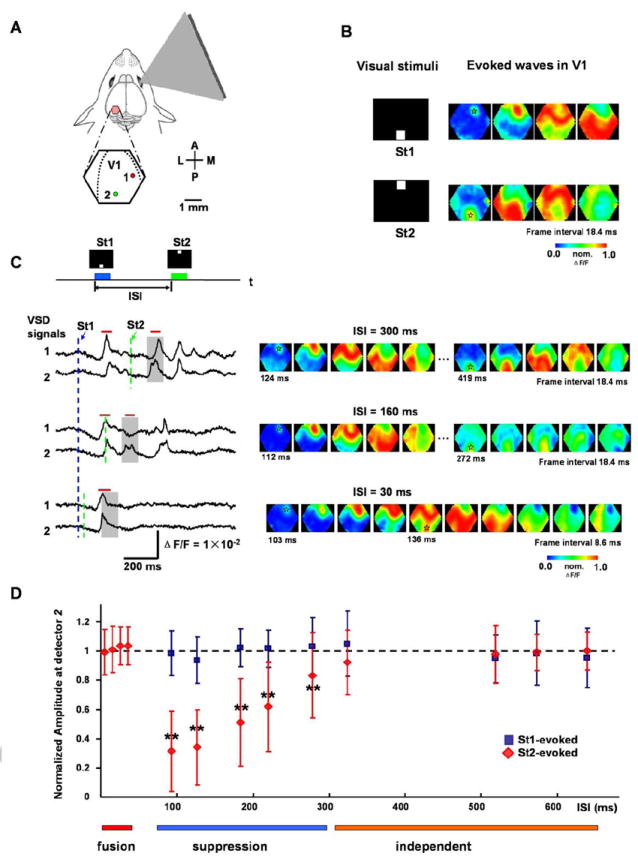
(A) Schematic drawing of experimental arrangement. The visual stimuli are bright squares (duration = 100 ms, 10 × 10 degrees visual angle), presented on a CRT screen to the right eye. A cranial window (5 mm in diameter) over the left visual cortex was centered over the primary visual area (V1). The hexagon outlines the imaging field (approximately 4 mm in diameter) and dashed lines mark the borders between V1 and V2. A: anterior, P: posterior, M: medial, L: lateral. Two detectors, 1 and 2, are selected from a total of 464 detectors, where 2 is near the retinotopic site of St2 and 1 is at a mid-medial location between the retinotopic sites of St1 and St2. Their signal traces are shown in (C). The pseudo-color images in B and C are 0.6-ms snap shot selected from a total of 5120 frames in a 3-second trial. The VSD signal on each detector is normalized to its own peak and converted to pseudo-color images according to a color scale (middle) after a 3-30 Hz temporal filtering and a 3 × 3 mean spatial filtering.
(B) Left: Visual stimuli displayed at the bottom (St1) or top (St2) of the screen. Right: Pseudo-color images of the response evoked by St1 or St2. The transparent asterisks mark the retinotopic site of St1 or St2.
(C) Interactions of responses evoked by two sequential visual stimuli. Top: Two squares St1 and St2, separated by 45 degrees of visual angle in the visual field, are displayed sequentially with a given inter-stimulus interval (ISI) (blue and green bars). Bottom: Left: Sample traces of optical signals (filtered by 3-200 Hz and heartbeat artifact removed) from detectors 1 and 2 (locations shown in A). The dashed lines mark the onset times of the stimuli (blue for St1 and green for St2). The gray shades indicate the time window for expected occurrence of St2 responses. Note that the response to St2 is reduced at ISI=160ms and fused into one peak with first response at ISI=30ms. Red bars on top of the traces mark the durations of the images on the right. Right: The pseudo-color images of the signals during the time period indicated by the red bars on the left. The time below images mark the timing (from the St1 onset) of the frames, in which the initiation sites are visible. The transparent asterisks mark the initial sites of the evoked waves. Note that at ISI = 30 ms, the second wave initiated before the arrival of the first wave and fused with the first wave.
(D) Amplitude reduction of the second wave. Data were collected from 1011 trials (16 animals). The amplitude was measured at the retinotopic site of St2 (e.g. detector 2 in A) and was normalized to that evoked by single stimulus in the same animal. Cross-animal averaging was done after the normalization. Blue squares are for the responses evoked by the first stimulus (St1) and red diamonds are for the responses evoked by the second stimulus (St2). T-test was done at each testpoint (the control is the amplitude of the wave evoked by a single stimulus St2) and those with significant difference were marked by “**” (p < 0.01). Color bars under the plot mark the time window for different types of interactions.