
Figure 2. Latency and half-width are shortened by wave fusion.
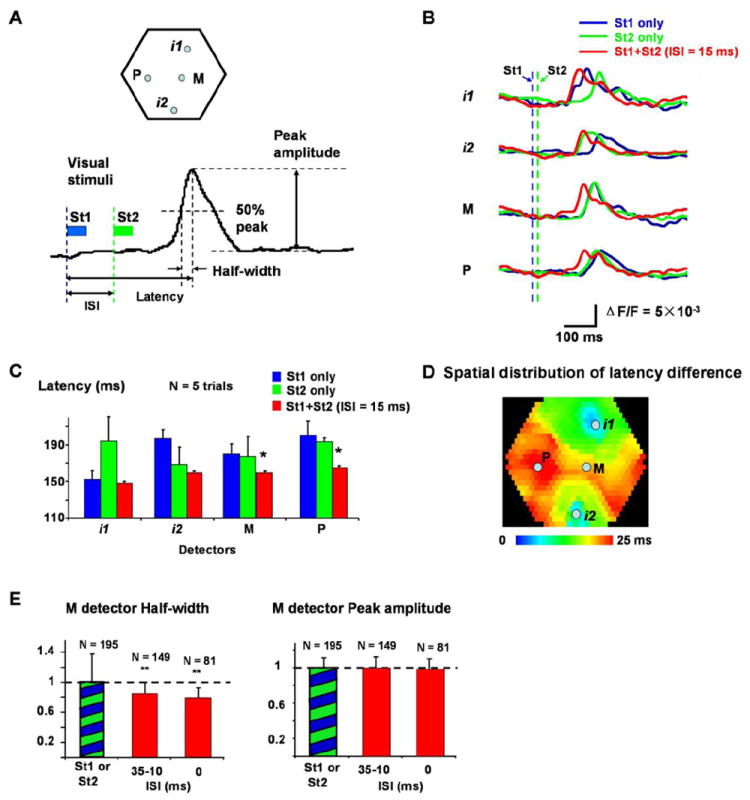
(A) Top: Locations of the four detectors, i1, i2, M and P used in (B-E). i1 and i2 are approximately at the retinotopic sites of St1 and St2; M is at the center of the line from i1 to i2, and P is about 1.5 mm lateral to M. Bottom: Definitions of ISI, latency, half-width and peak amplitude. Blue and green bars indicate the duration of the St1 and St2. Blue and green dashed lines mark the onset time of the two visual stimuli.
(B) Latency shortening seen in optical signals (single trial filtered by 1.5 - 30 Hz). Signals from four detectors, i1, i2, P and M are shown. Traces from three stimulation conditions are superimposed: St1 alone (blue), St2 alone (green), and St1 preceding St2 with 15 ms ISI (red). Blue and green dashed lines mark the onset time of St1 and St2.
(C) Latency shortening of 5 trials averaging. Latency at detectors M and P was significantly shortened when ISI = 15ms (marked by “*”, compare to both blue and green bars in the same group, t-test, p < 0.05). Data in C and B are from the same experiment.
(D) Spatial distribution of latency changes at ISI = 15 ms (averaged from 5 trials as in C). The color indicates the latency changes at each location, from no change (blue) to shortened 25 ms (red). The control latency on each detector is the lesser of the latency of St1 or St2 evoked response. Note that around retinotopic sites, the latency shows little changes (blue-green) while large changes occur in the middle areas between the two retinotopic sites.
(E) Changes in the half-width and peak amplitude. The signals at detector M were analyzed. Left: The half-width of the response at different ISIs (averaged from 6 animals). Columns marked by “**” are significantly different (t-test, p < 0.01) from the control (green-blue bar). Right: Peak amplitude of the response at different ISIs (averaged from 6 animals, cross-animal averaging was done after the normalization, same as Figure 1D). N is the number of averaged trials.