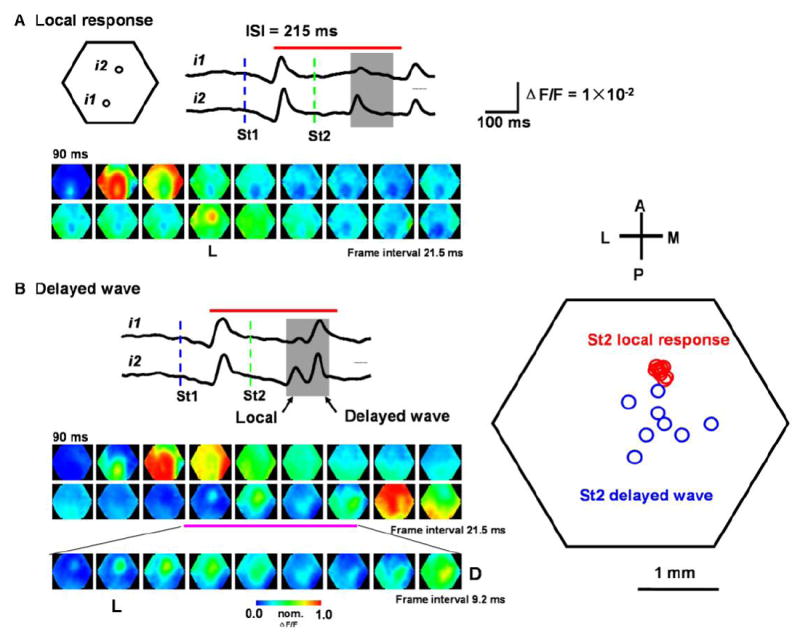
Figure 4. Suppression of the second wave.

(A) Local response evoked by the second stimulus. Top: Traces from the detectors i1 and i2 (filtered by 3-30 Hz). Blue and green dashed lines mark the onset time of the two stimuli. Gray shade indicates the time window for the expected occurrence of the second response. Red bar on the top of traces indicates the time window for the images at the bottom. Bottom: Pseudo-color images within the period marked by the red bar. Note that the response to St1 developed into a propagating wave, while the response to St2 is suppressed, with only a local response (image marked by “L”).
(B) Delayed wave evoked by the second stimulus. Left: Traces and images are from another trial of the same experiment. The second response (in the gray shade) showed two peaks. The first peak is much larger at i2 than at i1, corresponding to the local response seen in the bottom images (L). The second peak is seen in both i1 and i2 and the images indicate it is a propagating wave. The red bar on the top of the traces indicates the time window for the images in two upper rows. The third row of images is an expansion of part of the second row (marked by pink bar). Frames marked by “L” and “D” show the initiation sites of the local response and delayed wave respectively. Right: Initiation sites of local response and delayed waves from 8 trials of the same animal. Note that the initiation sites of the local response (red circles) are clustered around i2, while the initiation sites of the delayed wave (blue circles) are scattered in a larger area.
