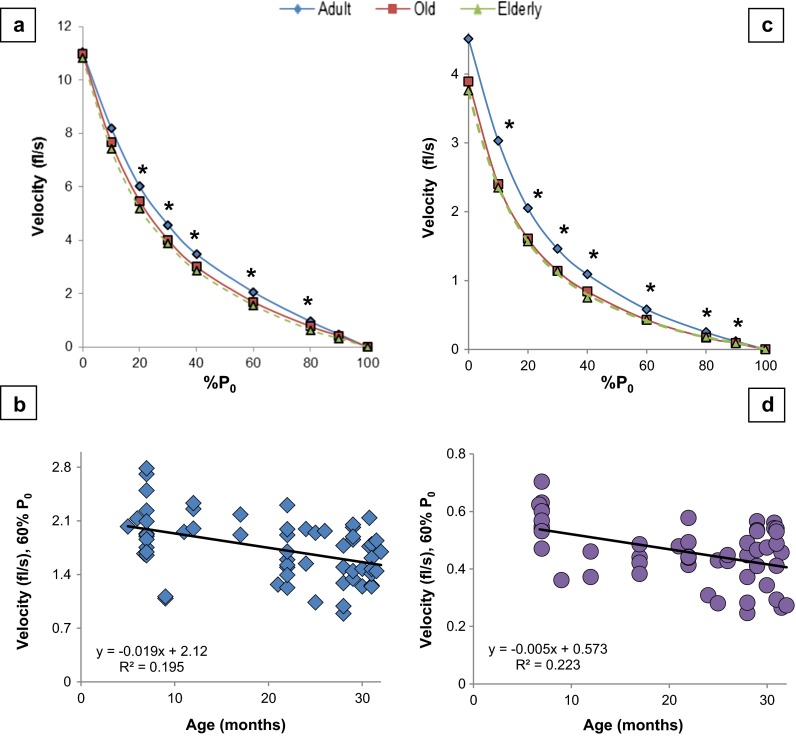
Fig. 1.
Velocity declines with age. a EDL force-velocity curve. b Linear regression of EDL velocity at 60 % P 0. See Fig. S1 in the supplement for the other velocities. c SOL force-velocity curve. d Linear regression of SOL velocity at 60 % P 0. See Fig. S2 in the supplement for the other velocities. See Table 1 and text for post hoc analysis. Each symbol in b and d in the regression graphs represents a measurement from an individual mouse at the given age. Equation: simple linear regression of velocity (y) as a function of age (x). *p < 0.05, p value from one-way ANOVA. fl/s fiber length per second, % P 0 percentage of maximum isometric force, Age age in months

