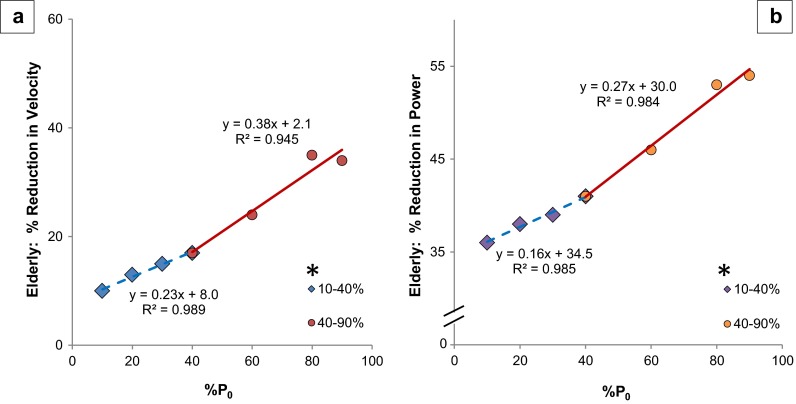
Fig. 2.
EDL velocity and power at heavier loads show increased age-related rate of decline. a Velocity. b Power equation: simple linear regression of % reduction in velocity and power of elderly mice (in comparison to adult mice) as a function of load (% P 0). Light loads (10–40 % P 0) are represented by diamonds with a dashed regression line and heavy loads (40–90 % P 0) are represented by circles and a solid regression line; 40 % P 0 is the inflection point indicating where the slope changes, and as such, the point is included in both sections of the graph. * = slope of line significantly different, p = 0.003 and p < 0.001 for velocity and power, respectively

