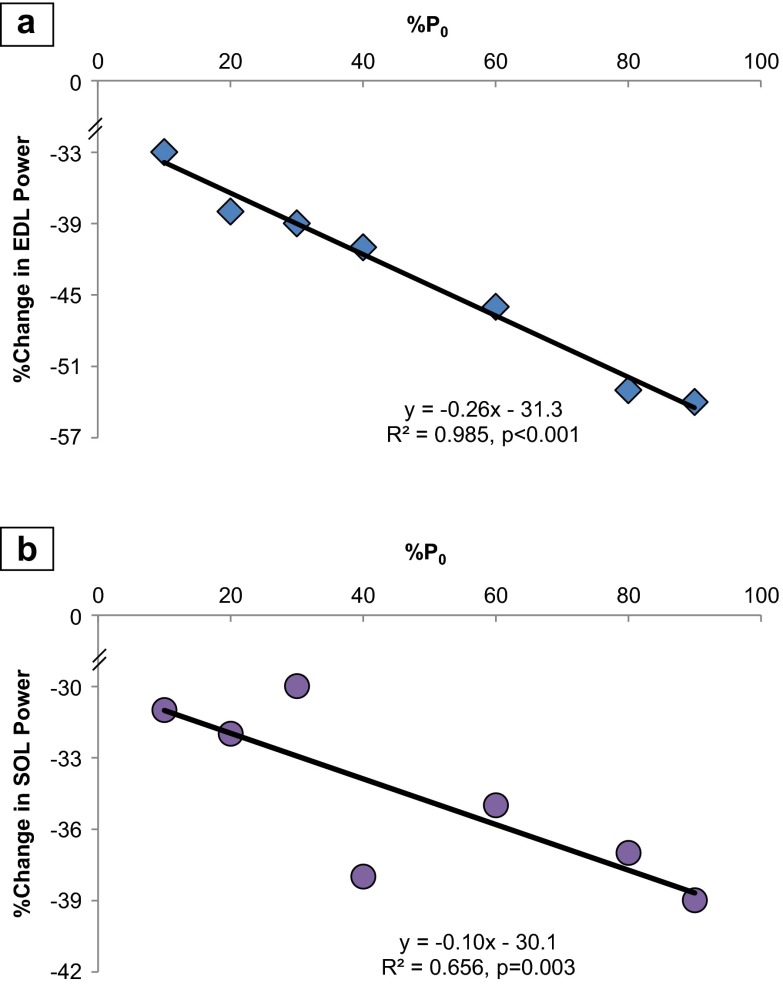
Fig. 5.
Percent reduction in power is correlated with increases in % P 0, comparing the elderly to adult. a EDL: There was a −0.26 % reduction in power per unit increase in load (% P 0, percentage of maximum force at which power was derived) (R = 0.993). b SOL: There was a percentage decrease of −0.10 (R = 0.810) in power, per unit increase in % P 0. Each symbol represents the difference between the mean power production of the entire adult group compared to the entire elderly group. Equation: simple linear regression of percent change in power from adult to elderly (y) as a function of % P 0

