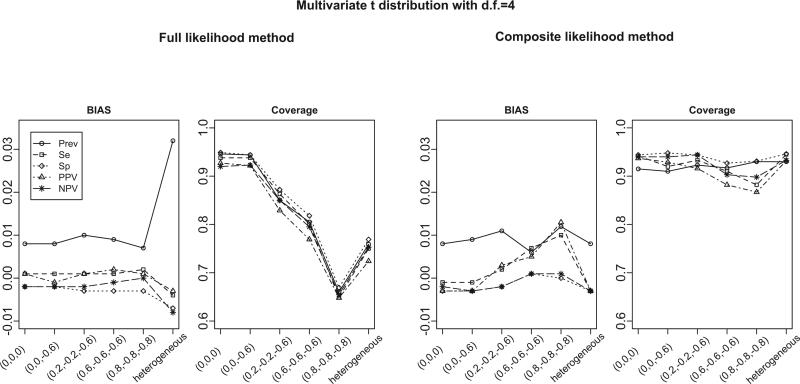
Figure 3.
Bias and coverage for estimated disease prevalence, sensitivity, specificity, PPV and NPV from the full likelihood (FL) and the composite likelihood (CL) methods. The true overall disease prevalence is 0.2, sensitivity is 0.9, and specificity is 0.9. The data are generated from bivariate t-distribution (for case-control studies) and trivariate t-distribution (for cohort studies). Results are summarized from 1000 simulations. The x-axis represents for the different settings of pairwise correlations among study-specific prevalence, sensitivity and specificity (in logit scale).

