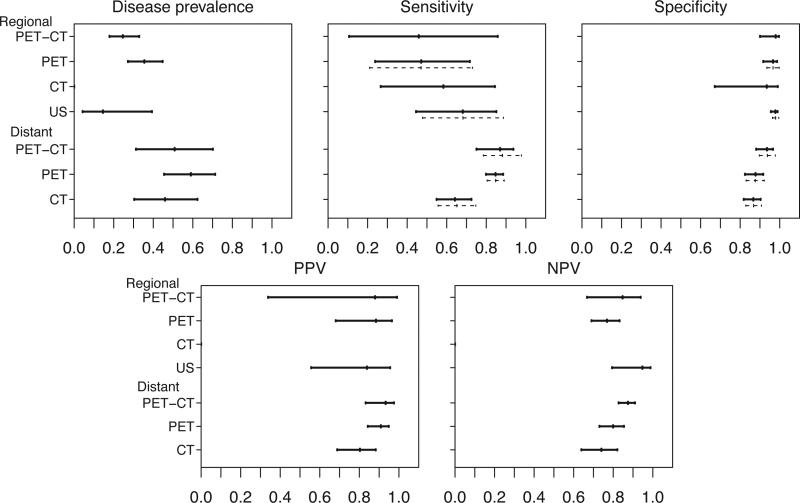
Figure 4.
Upper panels: estimated metastasis prevalence, sensitivities and specificities and 95% confidence intervals of four diagnostic imaging modalities using the composite likelihood method; Lower panels: estimated PPVs and NPVs and 95% confidence intervals of four diagnostic imaging modalities using the composite likelihood method. Solid lines: confidence intervals estimated from the CL method. Dashed lines: confidence intervals estimated from the bivariate GLMM method.

