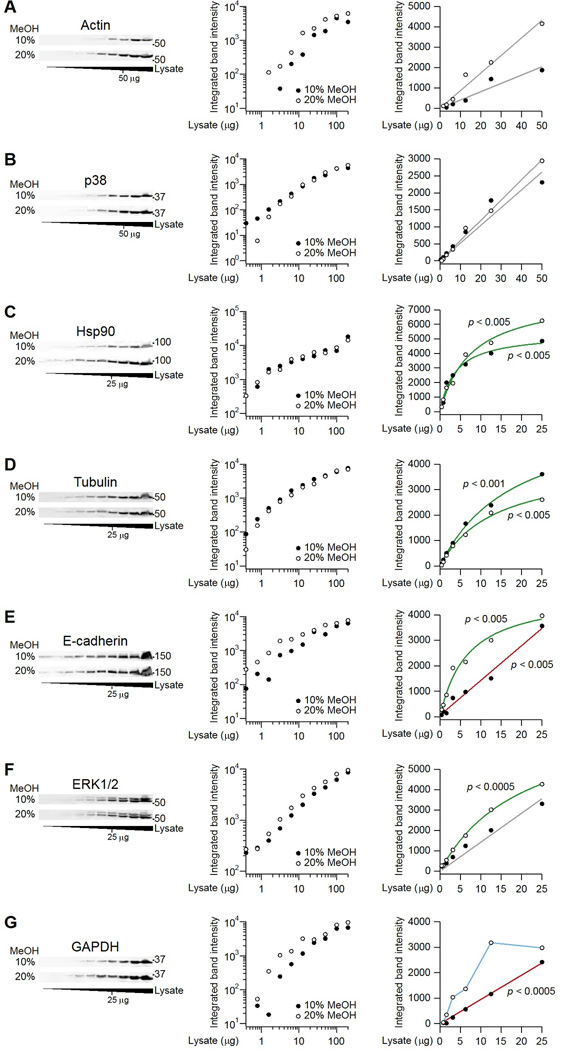
Fig. 4.
Linearity and hyperbolic saturation of immunoblots determined by serial dilution. (A and B) Immunoblots for actin and p38 are linear under both transfer conditions. (C and D) Immunoblots for Hsp90 and tubulin are hyperbolically saturated under both transfer conditions. (E to G) Linear detection of immunoblots for E-cadherin, ERK1/2, and GAPDH occurred with tank transfer conditions containing 10% methanol. HT-29 cells were lysed in RIPA buffer, immunoblotted for the indicated targets, and imaged. Left panels show the immunoblots, middle panels show log-log plots of the quantified band intensities from the blots on the left, and the right panels show linear plots of the same data. Linear fits are gray when the hyperbolic model is no better than the linear model for that transfer condition. Linear fits are red when the linear fit of the associated transfer condition is better than the linear fit of the other transfer condition. Hyperbolic fits are green when the hyperbolic model is better than the linear model for that transfer condition. Data are in blue when neither the linear nor the hyperbolic model provides a better fit. Model comparisons were done by the F test (FDR = 5%; n = 5–8 dilutions). See file S1 for raw images and calculations.

