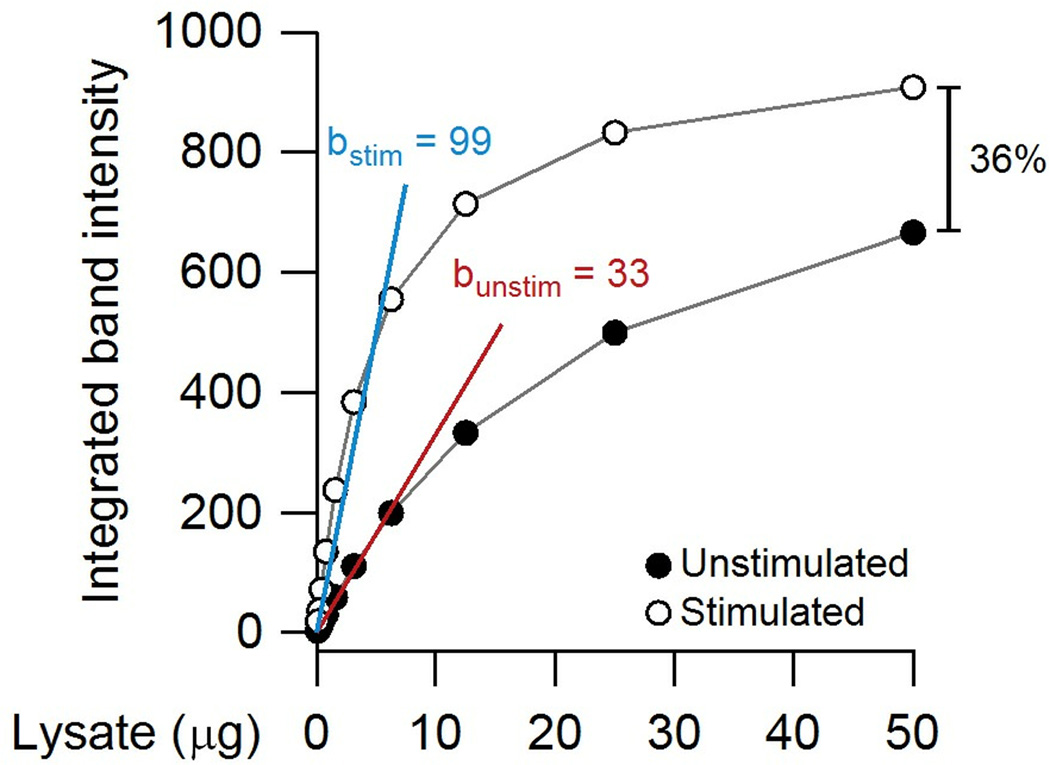
Fig. 9.
Quantifying partially saturated immunoblots can dramatically underestimate differences between samples. In this theoretical example, a serial dilution is performed with unstimulated and stimulated extracts. The relative change in the linear range of the immunoblot is 99 (blue) /33 (red) ~ threefold, whereas the relative change at fivefold higher loading is only 1.4 fold (36%).

