
Fig 8. Expression of soybean nodulation and nitrogen metabolism-related genes in roots in response to low nitrogen stress.
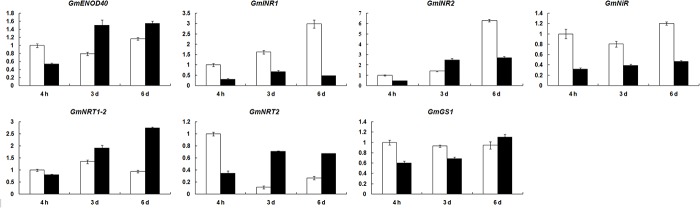
Data were obtained by real-time PCR normalized against the reference gene ACT11 and shown as a percentage of expression in control roots at 4 h. White column represents the expression under normal nitrogen condition, and black column represents the expression under limited nitrogen condition.