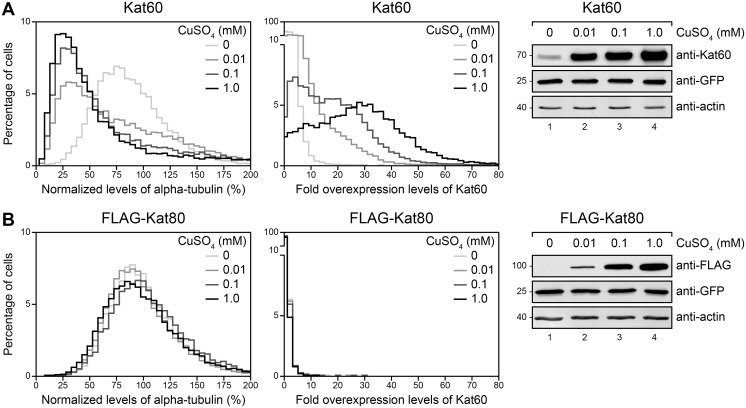
Fig 3. Inducible expression of Kat60 results in measurable microtubule disassembly in our single-cell assay.
(A and B) Histograms of normalized levels of alpha-tubulin (Left) and fold overexpression levels of Kat60 (Middle) in Drosophila S2 cells stably expressing GFP and copper-inducible Kat60 (A) or FLAG-Kat80 (B) that were treated with both Kat60 and Kat80 UTR dsRNA for 7 days total. The cells described in A and B were also treated with 0 (light gray), 0.01 (medium gray), 0.1 (dark gray), or 1.0 mM CuSO4 (black) for 20 hours and immunostained for alpha-tubulin and Kat60. Normalized levels of alpha-tubulin are expressed as a percentage of the mean levels of alpha-tubulin in cells stably expressing GFP alone that were treated with both Kat60 and Kat80 UTR dsRNA for 7 days total. Fold overexpression levels of Kat60 are expressed as a fraction of the difference in the mean levels of Kat60 between cells stably expressing GFP alone that were treated with control and both Kat60 and Kat80 UTR dsRNA for 7 days total. Data are pooled from three independent experiments (see S1 Table for summary statistics of the single-cell measurements collected). (Right) Immunoblots of cell lysates prepared from the cells described in A and B. Molecular weights (in Kd) are shown on the left.

