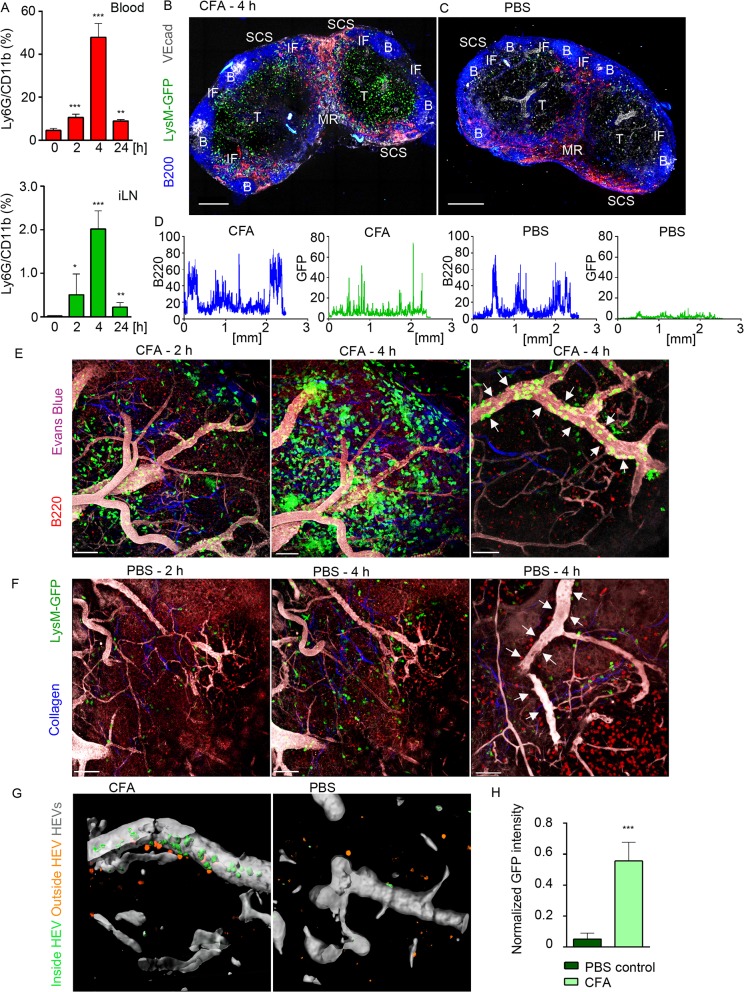
Fig 1. Neutrophils arrive from HEVs to occupy IFZ, MR and SCS in immunized iLN.
Mice were injected subcutaneously with CFA. C57BL/6 mice were subjected to flow cytometry analysis of whole blood and LN cell populations; LysM-GFP expression was imaged using confocal microscopy or TP-LSM. (A) Flow cytometry analysis of blood (upper panel) and iLN cells (lower panel) in immunized C57BL/6 mice between 0 and 24 h after injection. Percentages of Ly6Ghi/CD11bhi population in live cell gate are shown. N = 2 mice/4 iLNs, repeated 3 times. Means ± SEM (B, C) Mice were sacrificed 4 h after CFA or PBS injections. The iLNs were sectioned, immunostained and analyzed by confocal microscopy. Single Z stack images were collected and assembled to form a large tiled image of the whole iLN. TZ (T), IFZ (IF), medulla (MR), LN follicle (B), and SCS are labeled. Tiled confocal images of (B) immunized and (C) PBS injected control LysM-GFP iLNs with GFPhi neutrophils (green), B cells (B220, blue), lymphatics (LYVE-1, red) and blood vessels (VE-cadherin, gray) are shown. Scale bars: 300 μm; Z = 35 μm. (D) GFP (green) and B220 (blue) channels were split, profiles of intensities of fluorescence were plotted across the images of immunized and control iLNs and measured on a scale from 1 to 100. X axis: distance in mm. Representative for 10 random profiles plotted across each section. The images are representative of 10 mice analyzed. (E, F) For TP-LSM B cells (CMTPX, red) were adoptively transferred 24 h prior to imaging; blood vessels were visualized via intravenous injection of EB (gray); collagen fibers were seen as second harmonic generation (blue). TP-LSM images of (E) immunized (S1 Movie) and (F) PBS control iLN at 2 and 4 h after injections. Scale bars: 70 μm (left and middle panels). Single HEVs (white arrows) at 4 h after injections are shown. Scale bars: 50 μm (right panels). (G) An HEV volume was defined using Imaris, and neutrophils were distinguished as cells inside (green) or outside the blood vessel (orange) in immunized (left) and PBS control (right) iLN. (H) GFP intensity of cells inside HEVs was calculated for 5 random blood vessels in immunized versus PBS control iLN, and normalized for a blood vessel volume. 5 repeats; means ± SEM.

