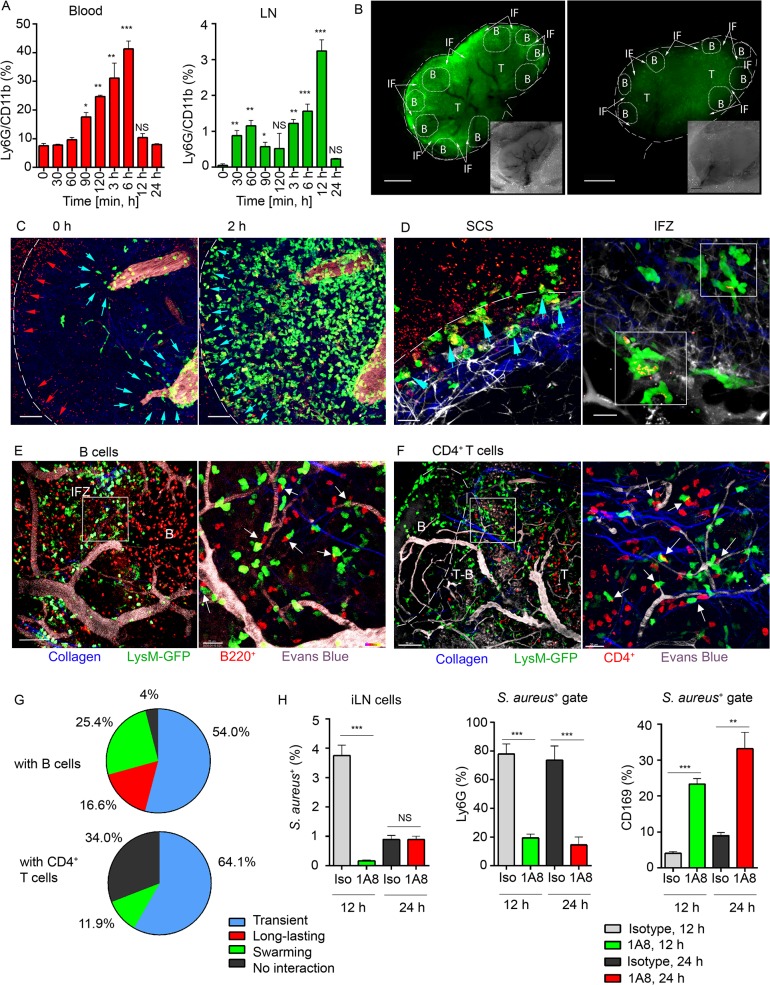
Fig 2. Local immunization with S. aureus bioparticles recruits neutrophils to the LN.
S. aureus bioparticles were opsonized and injected subcutaneously near the iLN. Neutrophil recruitment to the blood and lymphoid organs was analyzed by flow cytometry in C57BL/6 mice, or imaged using epifluorescent stereomicroscope or TP-LSM in LysM-GFP mice with adoptively transferred lymphocytes. (A) Kinetics of neutrophil recruitment to the blood (left panel) and to the iLN (right panel) between 0 and 24 h after immunization. N = 3 mice/6 iLNs; 3 independent experiments. Means ± SEM. (B) Fluorescent (main image) and bright field (lower right corner) images of immunized and PBS control LysM-GFP LNs are shown at 12 h after injection. Neutrophils: LysM-GFP, green. Image labeling: SCS (white dashed line), TZ (T), IFZ (IF, white arrows), LN follicles (B, dotted lines). Data is representative of 3 mice (6 iLNs) per group. (C) TP-LSM images of neutrophils (LysM-GFP, green) exiting blood vessels in the LN stroma (left panel, blue arrowheads) and accumulating in the SCS (right panel, blue arrowheads) between 2 h (left) and 4 h (right) after S. aureus (red arrowheads) injection are shown (S3 Movie, Mobilization). ILN border, white dashed line; HEVs, EB, gray. Scale bars: 50 μm. (D) Neutrophils phagocytizing S. aureus in the SCS (left panel, blue arrowheads) and swarming in the IFZ (right panel, white squares) between 3 and 4 h after S. aureus inoculation are shown (S3 Movie, Swarming). Scale bars: 25 μm (right), 20 μm (left). Data is representative of 12 imaging sessions. (E, F) DsRed B cells or CD4+ T cells were adoptively transferred 24 h prior to imaging. Neutrophil (green) interactions with (E) B cells (red) or (F) CD4+ T cells (red) at the T-B border (dashed line) at 12 h after S. aureus injection are shown. Blood vessels, EB (gray); collagen, second harmonic (blue). Scale bars: (C) 50 μm; (D, left) 50 μm; (D, right) 20 μm, (E, left) 50 μm; (E, right) 20 μm; (F, left) 70 μm; (F, right) 20 μm. (G) The percentages of short and long-lasting interactions formed by neutrophils with B cells (upper chart) and by neutrophils with CD4+ T cells (lower chart). Data is representative of 3 independent computations. (H) Analysis of S. aureus uptake by Ly6G+ and CD169+ populations in the iLN of isotype control or 1A8-injected mice between 0 and 48 h after immunization. N = 4 iLNs; 3 repeats. Means ± SEM.

